12
due to many factors including agrarian distress, non-viability of a large
section of holdings, urge to search for alterative avenues of employment,
indebtedness, etc. It may be mentioned that the agrarian distress in
certain parts of the country has been so severe that a large number of
farmers have committed suicide (Singh, 2006: 39-40; 43).
These questions of agrarian distress become relevant to an analysis
of current and potential credit flow from institutional agencies. The tiny
operational holdings are uneconomic and require innovative measures to
expand their credit base for agricultural operations. More importantly, there
is no way small and marginal farmer households can improve their living
standards by depending solely on agricultural incomes (Radhakrishna 2007).
Therefore, there is the need for supporting off-farm and non-farm activities,
again with innovative methods of financing.
Imperatives of Conferring Greater Focus on Marginal Farmers
In seeking to thus address the question of agrariandistress, it is necessary
to single out the marginal farmers as distinguished from other farmers, even
as distinguished from small farmers. The literature generally brackets small
and marginal farmers together, as though their landholding profile is similar,
if not identical. This is in fact not so; there are a few distinguishing features
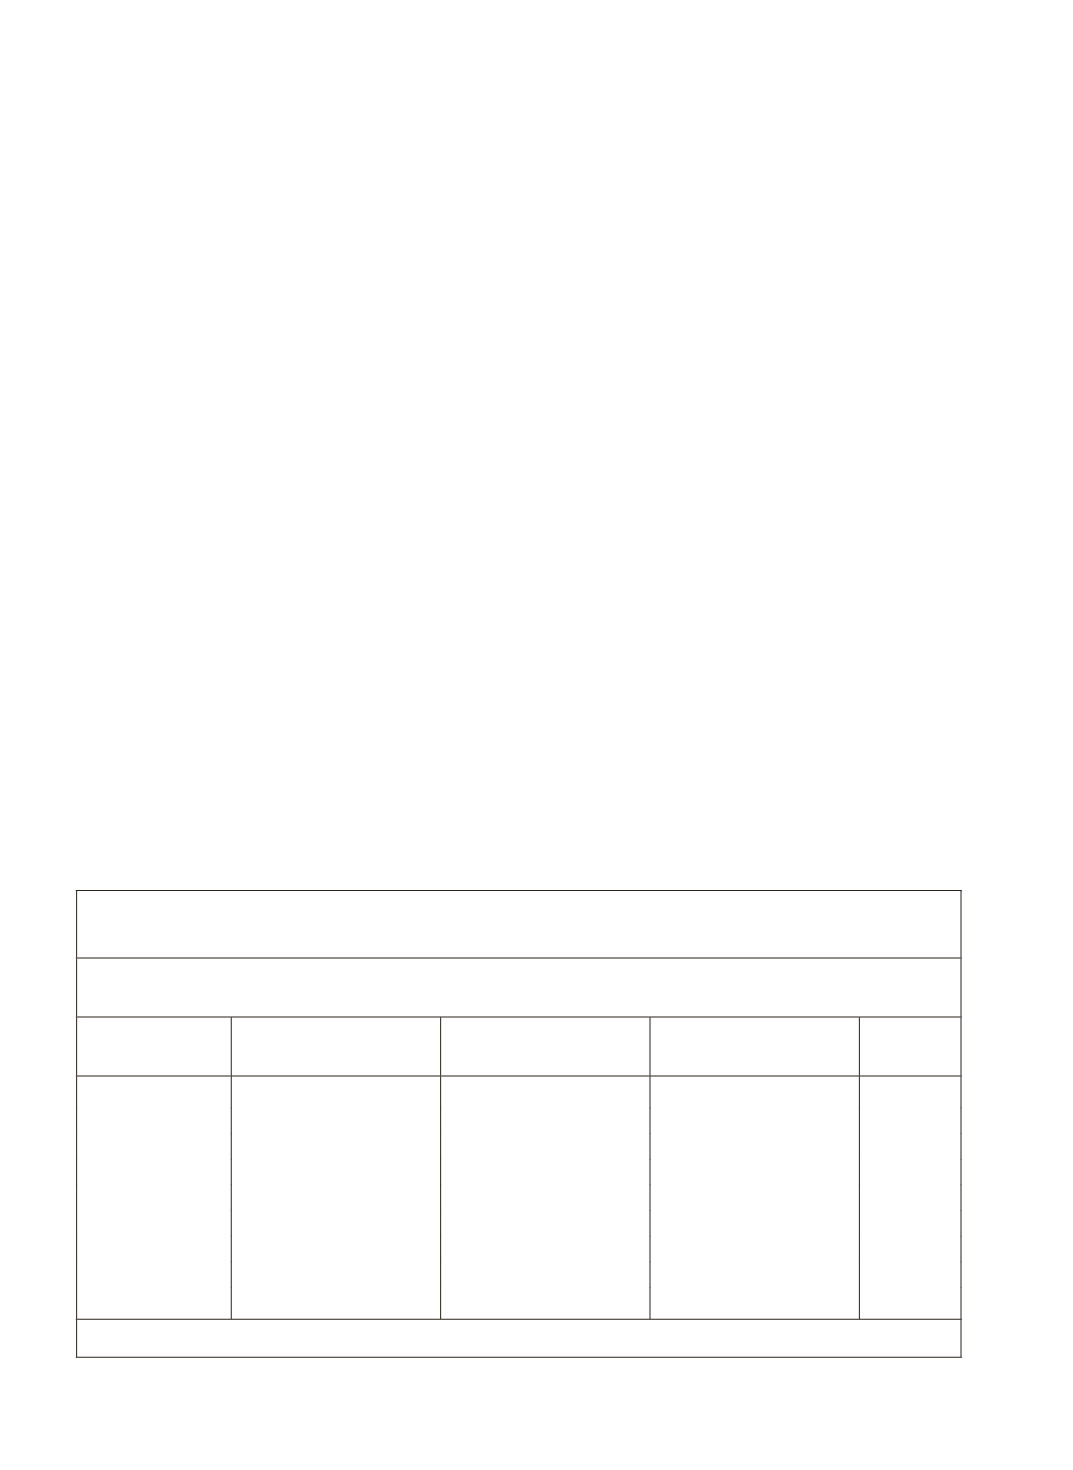
which stand out in further analysis. As shown in Table 2.6, the average size of
landholding amongst marginal farmers constitutes just a little over one-fourth
of the average holdings amongst small farmers. From the point of view of eking
out a family living and from the point of view of sustaining certain level of
Table 2.6: Steeper Marginalisation of Marginal Farmers:
Declines in Average Landholdings
Average Landholdings in Hectares
By Size Groups
Year
Marginal Farmers
(Up to 1 hectares)
Small Farmers
(1 to 2 hectares)
All Other Size Groups Total
1970-71
0.403
1.436
6.001
2.28
1976-77
0.393
1.419
5.598
2.00
1980-81
0.394
1.442
5.328
1.84
1985-86
0.393
1.434
5.060
1.69
1990-91
0.393
1.435
4.827
1.55
1995-96
0.395
1.419
4.592
1.41
2000-01
0.395
1.416
4.466
1.33
2005-06
0.383
1.383
4.315
1.23
2010-11
0.383
1.422
4.283
1.16
Source:
As in Table 2.4 (1 Hectare = 2.5 acres)


