216
much the larger part of the increase in credit to GDP ratio has occurred in
long-term disbursements, and more so in outstandings, because of staggered
repayment schedules. Again, because the commercial banks took a back seat
in the 1990s, the sharpest fall in the ratio has occurred in long-term farm
credit outstandings (Table 8.3).
Official series for the 1990s and thereafter
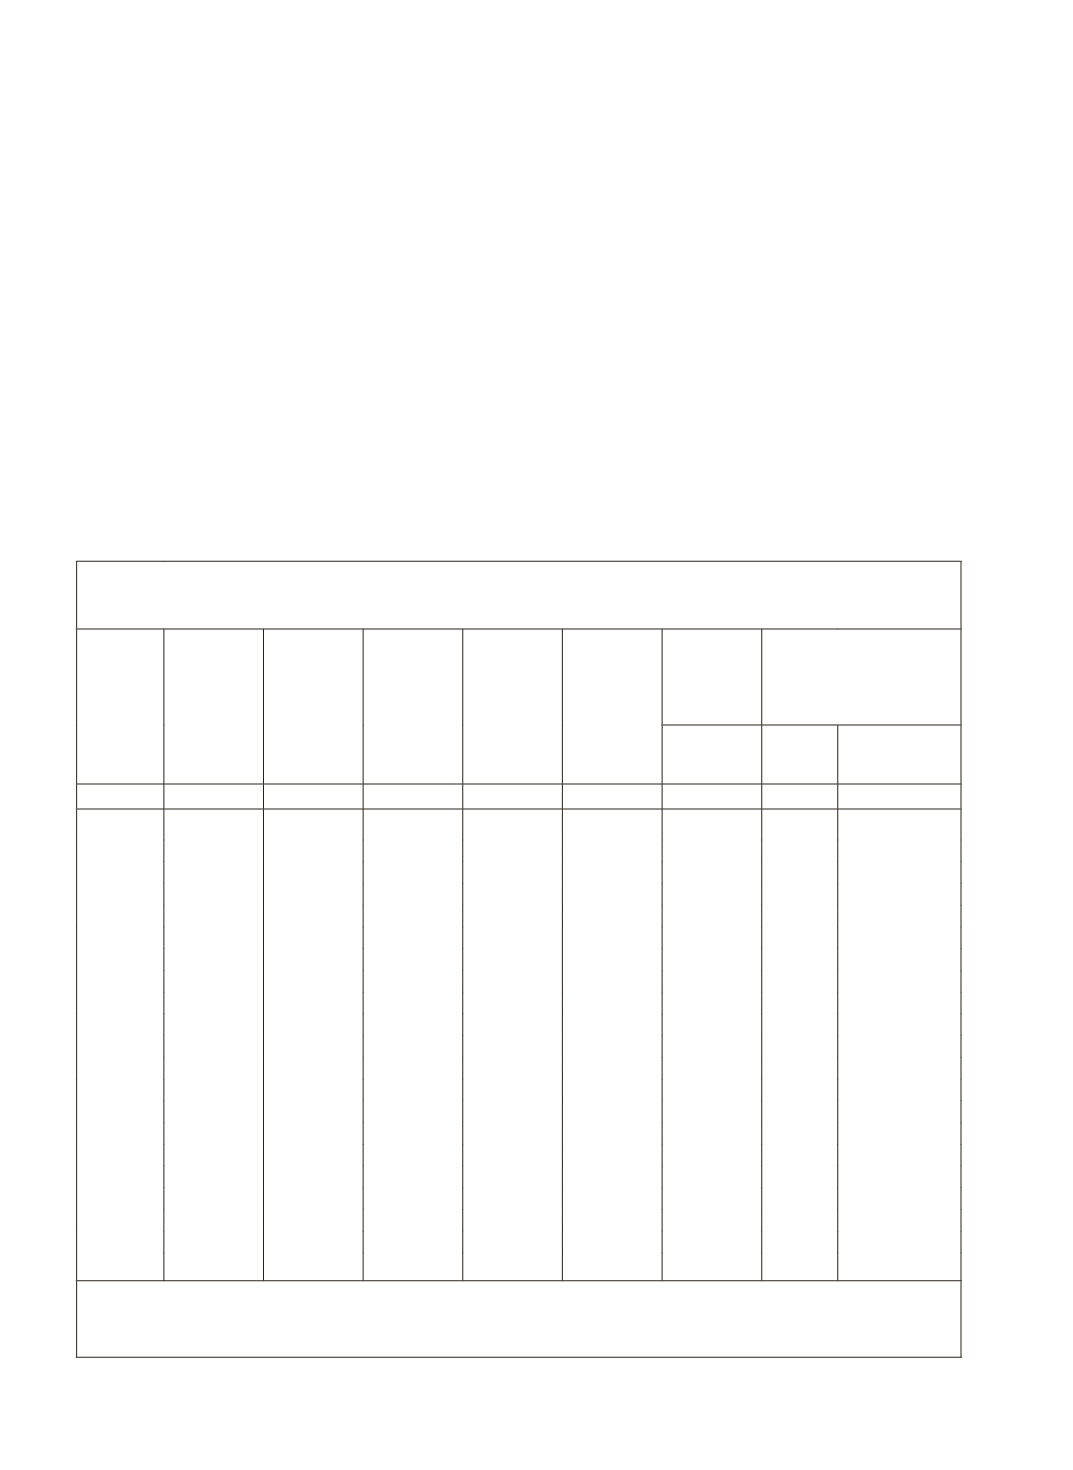
We have discussed the profiles of fresh data disseminated by NABARD
in coordination with RBI for the 1990s and thereafter, the relevant data are
presented in Table 8.4 (original series) along with the ratios displaying the
relationship between credit and real sector indicators.
The fresh credit flow data so worked out are thus related to four demand-
side indicators: gross value of gross output; sectoral GDP; inputs; and gross
capital formation. These data confirm that after 2000-01 or thereabout, there
Table 8.4: Total Ground-Level Flow of Institutional Credit for Agriculture and
Allied Activities in Relation to Output, Inputs and GDP
-
Official Series
Year
Value of
Output
of
Agriculture
and Allied
Activities
(
`
Crore)
Value of
Input of
Agriculture
and Allied
Activities
(
`
Crore)
GDP from
Agriculture
and Allied
Activities #
(
`
Crore)
Short-Term
Credit
(
`
Crore)
Total Credit
Flow (Short
and
Long Term)
(
`
Crore)
Short-Term
Credit as
Percentage
of
Total Credit Credit as
Percentage of
Value
of Input
Value of
Output
Agriculture
GDP
(1)
(2)
(3)
(4)
(5)
(7)
(8)
(9)
(10)
1991-92 210108 60361 180313
11202
5.3
6.2
1992-93 232571 64613 202219
15169
6.5
7.5
1993-94 266297 71121 234566 11271 16494
15.8
6.2
7.0
1994-95 306075 81709 270107 11932 18744
14.6
6.1
6.9
1995-96 335498 92302 293701 14525 22032
15.7
6.6
7.5
1996-97 392046 95539 353142 16998 26411
17.8
6.7
7.5
1997-98 416589 106617 374744 20640 31956
19.4
7.7
8.5
1998-99 478802 119828 430384 23903 36860
19.9
7.7
8.6
1999-00 512628 138082 455302 28965 46268
21.0
9.0
10.2
2000-01 512970 137338 460608 33314 52827
24.3
10.3
11.5
2001-02 553591 147343 498620 40509 62045
27.5
11.2
12.4
2002-03 540755 153174 485080 45586 69560
29.8
12.9
14.3
2003-04 615691 170561 544667 54977 86981
32.2
14.1
16.0
2004-05 638530 175865 565426 76062 125309
43.3
19.6
22.2
2005-06 716839 194936 637772 105350 180486
54.0
25.2
28.3
2006-07 801496 214187 722984 138455 229400
64.6
28.6
31.7
2007-08 828785 231800 836518 181393 254658
78.3
30.7
30.4
2008-09 1049121 264214 943204 210461 301908
79.7
28.8
32.0
2009-10 1199744 301056 1083514 276656 384514
91.9
32.0
35.5
2010-11 1416441 354437 1306942 335550 468291
94.7
33.1
35.8
2011-12
1465753
509040
34.7
Note:
Data are at Current Prices.
Source:
(i) Value of output, Value of inputs and GDP are from
CSO’s National Accounts Statistics 2012
and back
series (ii) For Credit flow, data see earlier Table 5.9.


