214
ratio for the sector, from 9.4% in 1997-98 to 27.1% 2005-06 and further to a
whopping 35%-36% in years 2009-10/2010-11.
Thereby hangs an important supply-side story of commercial banks
behaviour, to which we have made pointed reference in Chapter 4 earlier. The
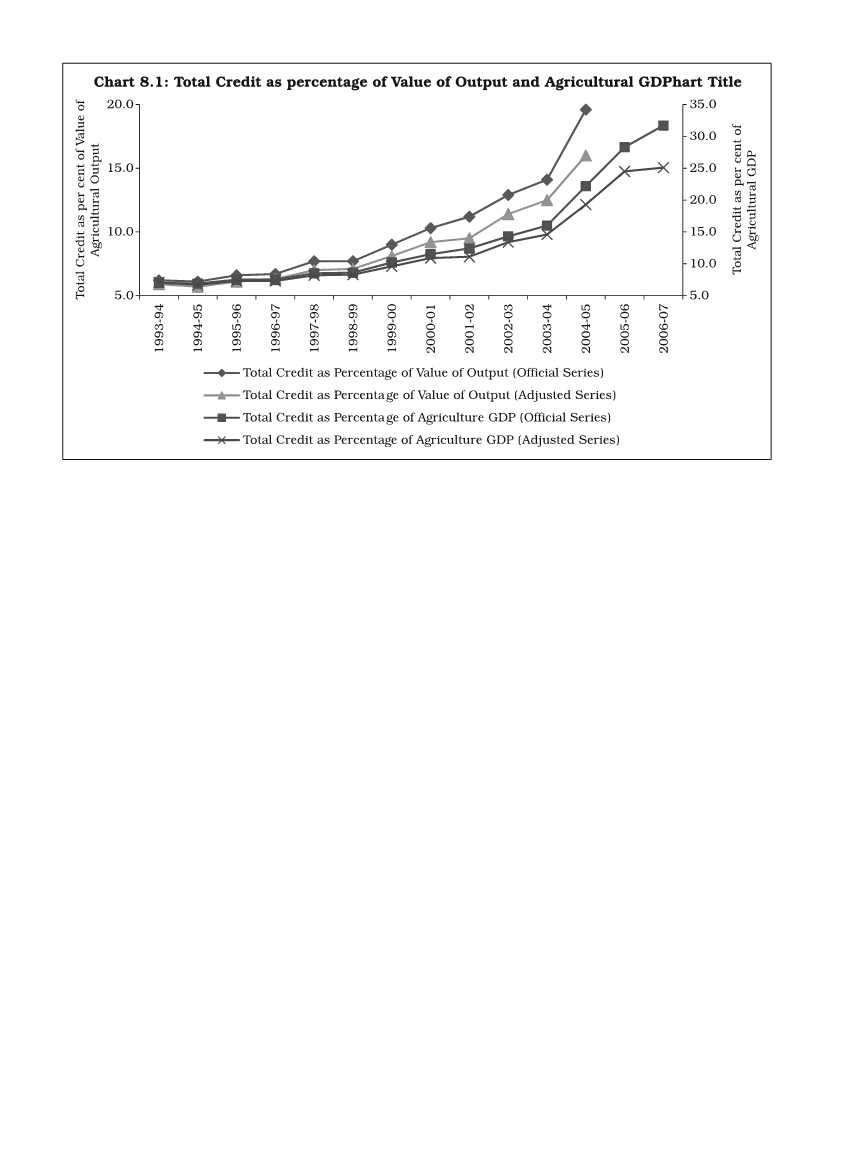
three-phase behaviour of credit to GDP ratios – expansion, slowdown and
rapid rise – has been almost similar when we consider total agricultural credit
including indirect lendings (Part B of Table 8.1). When we juxtapose bank credit
to sectoral GDP ratios of all the three major sectors – agriculture, industry
and services, we find that there has hardly been any erosion in these ratios in
respect of industry and services to the extent that have occurred for agriculture
in the 1990s. While, for the services sector, the ratio has been continuously
on the uptrend, the industry ratio fell only for a brief period in the mid-1990s
and continued to rise thereafter – so much so that the industry’s credit share
at 80.5% in 2010-11 has touched more than three times the industrial sector’s
GDP share at 26.1 (Table 8.2); likewise, the services sector credit share at
50.6% has grown fast and come close to the sector’s GDP share at 56.5%. Any
detailed probing into the behaviour of these sectoral ratios is beyond the scope
of this study, but there is no doubt that the agricultural sector has received
some step-motherly treatment in the hands of the scheduled commercial
banks, which brought about the social pressure to implement the policy of
doubling of bank credit for the sector during the recent years (2004-05 and
thereafter) though such a knee-jerk reaction by government is also fraught with
many an adverse consequence (more on it later).


