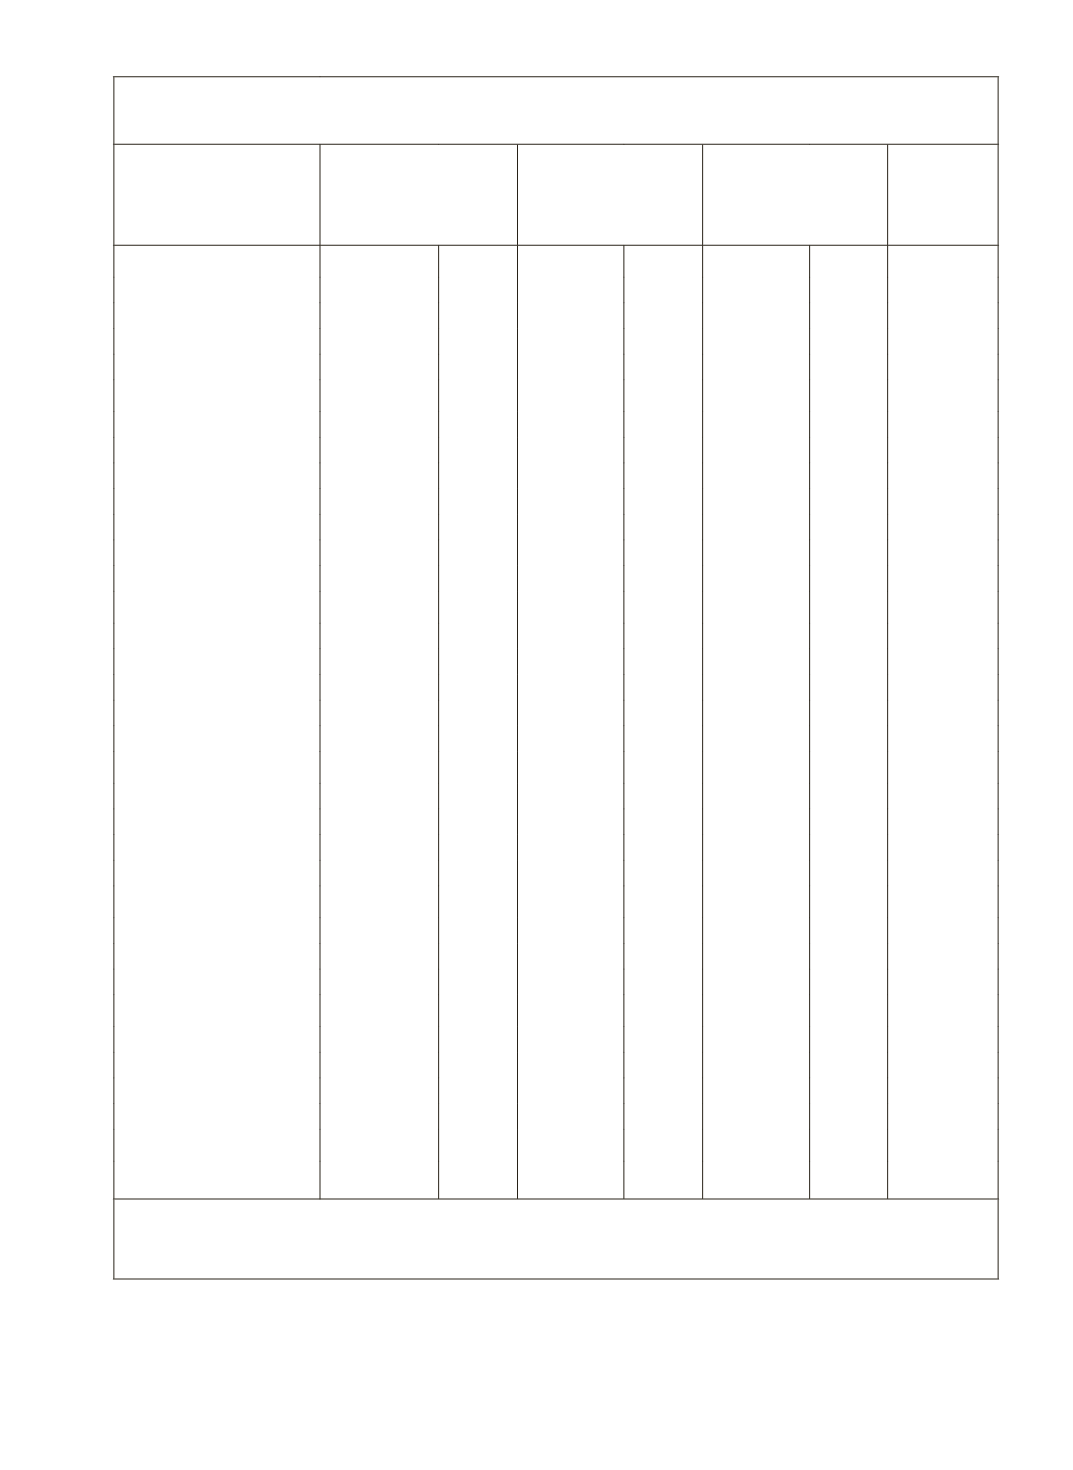
287
Annexure C: Estimated number of Rural Households and
Total and Indebted Farmer Households
State/Region
Estimated
Number of
Rural
Households
Estimated
Number of
Farmer
Households
Estimated
Number of
Indebted
Farmer
Percentage
of Farmer
Households
Indebted
Northern Region
83667 (5.7)
56380 (6.3)
28432 (6.5)
50.4
Haryana
31474 (2.1)
19445 (2.2)
10330 (2.4)
53.1
Himachal Pradesh
11928 (0.8)
9061 (1.0)
3030 (0.7)
33.4
Jammu & Kashmir
10418 (0.7)
9432 (1.1)
3003 (0.7)
31.8
Punjab
29847 (2.0)
18442 (2.1)
12069 (2.8)
65.4
North-Eastern Region
70915 (4.8)
34874 (3.9)
6870 (1.6)
19.7
Arunachal Pradesh
15412 (1.0)
1227 (0.1)
72 (0.0)
5.9
Assam
41525 (2.8)
25040 (2.8)
4536 (1.0)
18.1
Manipur
2685 (0.2)
2146 (0.2)
533 (0.1)
24.8
Meghalaya
3401 (0.2)
2543 (0.3)
103 (0.0)
4.1
Mizoram
942 (0.1)
780 (0.1)
184 (0.0)
23.6
Nagaland
973 (0.1)
805 (0.1)
294 (0.1)
36.5
Tripura
5977 (0.4)
2333 (0.3)
1148 (0.3)
49.2
Eastern Region
342461 (23.2)
211140 (23.6)
84396 (19.4)
40.0
Bihar
116853 (7.9)
70804 (7.9)
23383 (5.4)
33.0
Jharkhand
36930 (2.5)
28238 (3.2)
5893 (1.4)
20.9
Orissa
66199 (4.5)
42341 (4.7)
20250 (4.7)
47.8
Sikkim
812 (0.1)
531 (0.1)
174 (0.0)
32.8
West bengal
121667 (8.2)
69226 (7.7)
34696 (8.0)
50.1
Central Region
363672 (24.6)
271341 (30.4)
113045 (26.0)
41.7
Chattisgarh
36316 (2.5)
27598 (3.1)
11092 (2.6)
40.2
Madhya Pradesh
93898 (6.3)
63206 (7.1)
32110 (7.4)
50.8
Uttar Pradesh
221499 (15.0)
171575 (19.2)
69199 (15.9)
40.3
Uttranchal
11959 (0.8)
8962 (1.0)
644 (0.1)
7.2
Western Region
251364 (17.0)
156742 (17.5)
83570 (19.2)
53.3
Rajasthan
70172 (4.7)
53080 (5.9)
27828 (6.4)
52.4
Gujarat
63015 (4.3)
37845 (4.2)
19644 (4.5)
51.9
Maharashtra
118177 (8.0)
65817 (7.4)
36098 (8.3)
54.8
Southern Region
372544 (25.2)
161578 (18.1)
117470 (27.1)
72.7
Andhra Pradesh
142512 (9.6)
60339 (6.8)
49493 (11.4)
82.0
Karnataka
69908 (4.7)
40413 (4.5)
24897 (5.7)
61.6
Kerala
49942 (3.4)
21946 (2.5)
14126 (3.3)
64.4
Tamil Nadu
110182 (7.4)
38880 (4.4)
28954 (6.7)
74.5
Uts
2325 (0.2)
732 (0.1)
372 (0.1)
50.8
All India
1478988 (100.0)
893504 (100.0)
434242 (100.0)
48.6
Note:
Figures in brackets are percentages to all-India total
Source:
NSSO (2005), Indebtedness of Farmer Households, 59 th Round (Jan-Dec 2003) Report No. 498
(59/33/1)


