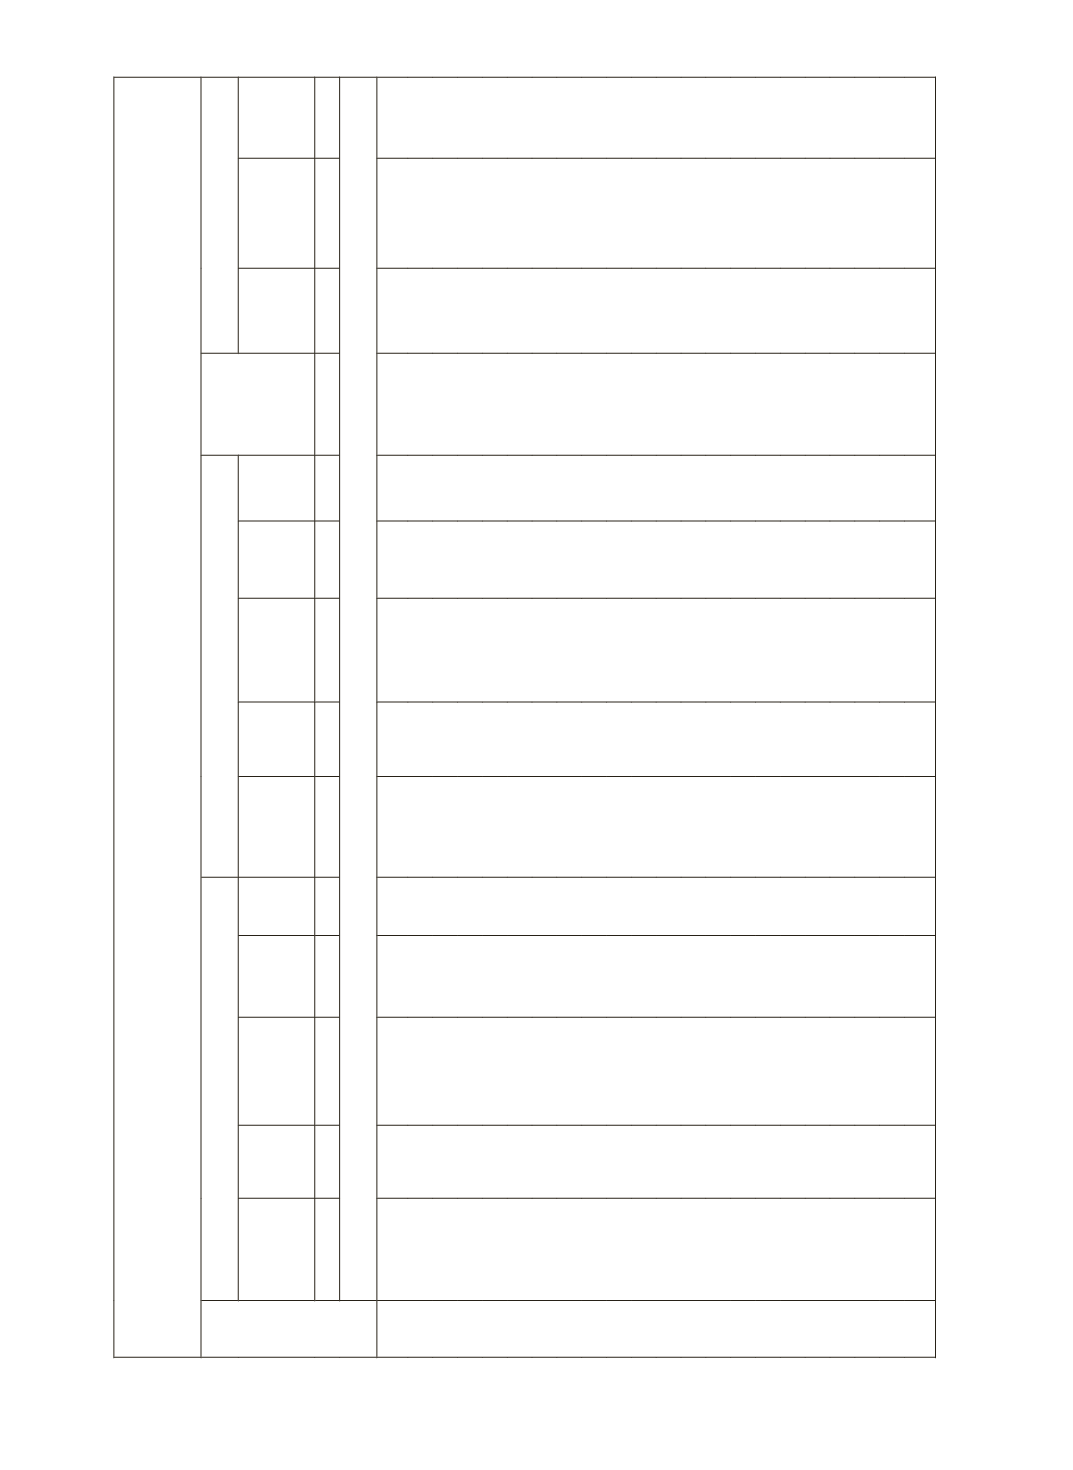
297
(Amount in Rupees Lakh)
Year
AS PER PLACE OF SANCTION
AS PER PLACE OF UTILISATION
Extent
of net
migration
(in percent)
Migration of Credit
No. of
Accounts
% to
All
India
Amount
Outstanding
% to
All India
C-D
Ratio
No. of
Accounts
% to
All
India
Amount
Outstanding
% to
All India
C-D
Ratio
No. of
Accounts
Amount
Outstanding
Average
Amount
1
2
3
4
5
6
7
8
9
10
SEMI-URBAN
1990 15559090 28.9
1787551
17.1 49.1 15459268 28.7 1759668
16.9 48.5
-1.6 -99822
-27883
0.3
1991 17478045 28.2
2030744
16.4 49.0 17420175 28.1 2080012
16.7 50.2
2.4 -57870
49268
-0.9
1992 17157526 26.1
2159928
15.8 46.4 17132429 26.0 2284209
16.7 49.0
5.8 -25097
124281
-5.0
1993 16897525 27.2
2359174
14.5 44.0 16885421 27.2 2536706
15.6 47.3
7.5 -12104
177532 -14.7
1994 16125272 27.0
2455394
14.0 39.0 16114114 27.0 2648635
15.1 42.0
7.9 -11158
193241 -17.3
1995 16843791 29.0
2839385
13.5 39.7 16854810 29.0 3180732
15.1 44.5
12.0 11019
341347
31.0
1996 15929562 28.1
3327877
13.1 40.0 15907178 28.1 3689050
14.5 44.3
10.9 -22384
361173 -16.1
1997 15908331 28.6
3738360
13.1 38.1 15838789 28.5 4060202
14.3 41.4
8.6 -69542
321842
-4.6
1998 15144681 28.3
4236013
12.8 36.6 15082849 28.1 4651029
14.1 40.2
9.8 -61832
415016
-6.7
1999 14454804 27.6
4851270
12.7 35.7 14457568 27.6 5482002
14.3 40.3
13.0
2764
630732 228.2
2000 14857984 27.3
5612744
12.2 34.7 14865267 27.3 6479048
14.1 40.0
15.4
7283
866304 118.9
2001 14043306 26.8
6173715
11.5 33.2 14046994 26.8 7110588
13.2 38.2
15.2
3688
936873 254.0
2002 15039559 26.7
7381429
11.3 34.3 15037018 26.7 9015634
13.7 41.9
22.1 -2541
1634205 -643.1
2003 15445695 26.0
8541155
11.3 35.3 15434247 25.9 10414943
13.8 43.1
21.9 -11448
1873788 -163.7
2004 16080257 24.2 10016603
11.4 37.3 16108316 24.3 11487098
13.0 42.8
14.7 28059
1470495
52.4
2005 18202838 23.6 13064117
11.3 44.2 18225926 23.6 14283629
12.4 48.3
9.3 23088
1219512
52.8
2006 21282079 24.9 15144546
10.0 50.1 21474702 25.1 17479436
11.5 57.8
15.4 192623
2334890
12.1
2007 21943167 23.2 18823184
9.7 52.7 22099371 25.9 21275279
14.1 59.5
13.0 156204
2452095
15.7
2008 23817432 22.3 22903050
9.5 53.2 24020664 28.1 25599845
16.9 59.5
11.8 203232
2696795
13.3
2009 24539599 22.3 26492516
9.3 50.0 24792743 29.0 31108903
20.5 58.7
17.4 253144
4616387
18.2
2010 26875601 22.7 31997287
9.6 52.1 27047387 31.7 36785945
24.3 59.9
15.0 171786
4788658
27.9
2011 28672791 23.8 38157275
9.4 53.2 28771812 23.8 45198703
11.1 63.1
18.5 99021
7041428
71.1
Annexure F: Population Group-Wise Outstanding Credit Of Scheduled Commercial Banks
according to Place of Sanction & Utilisation
(Contd.)


