309
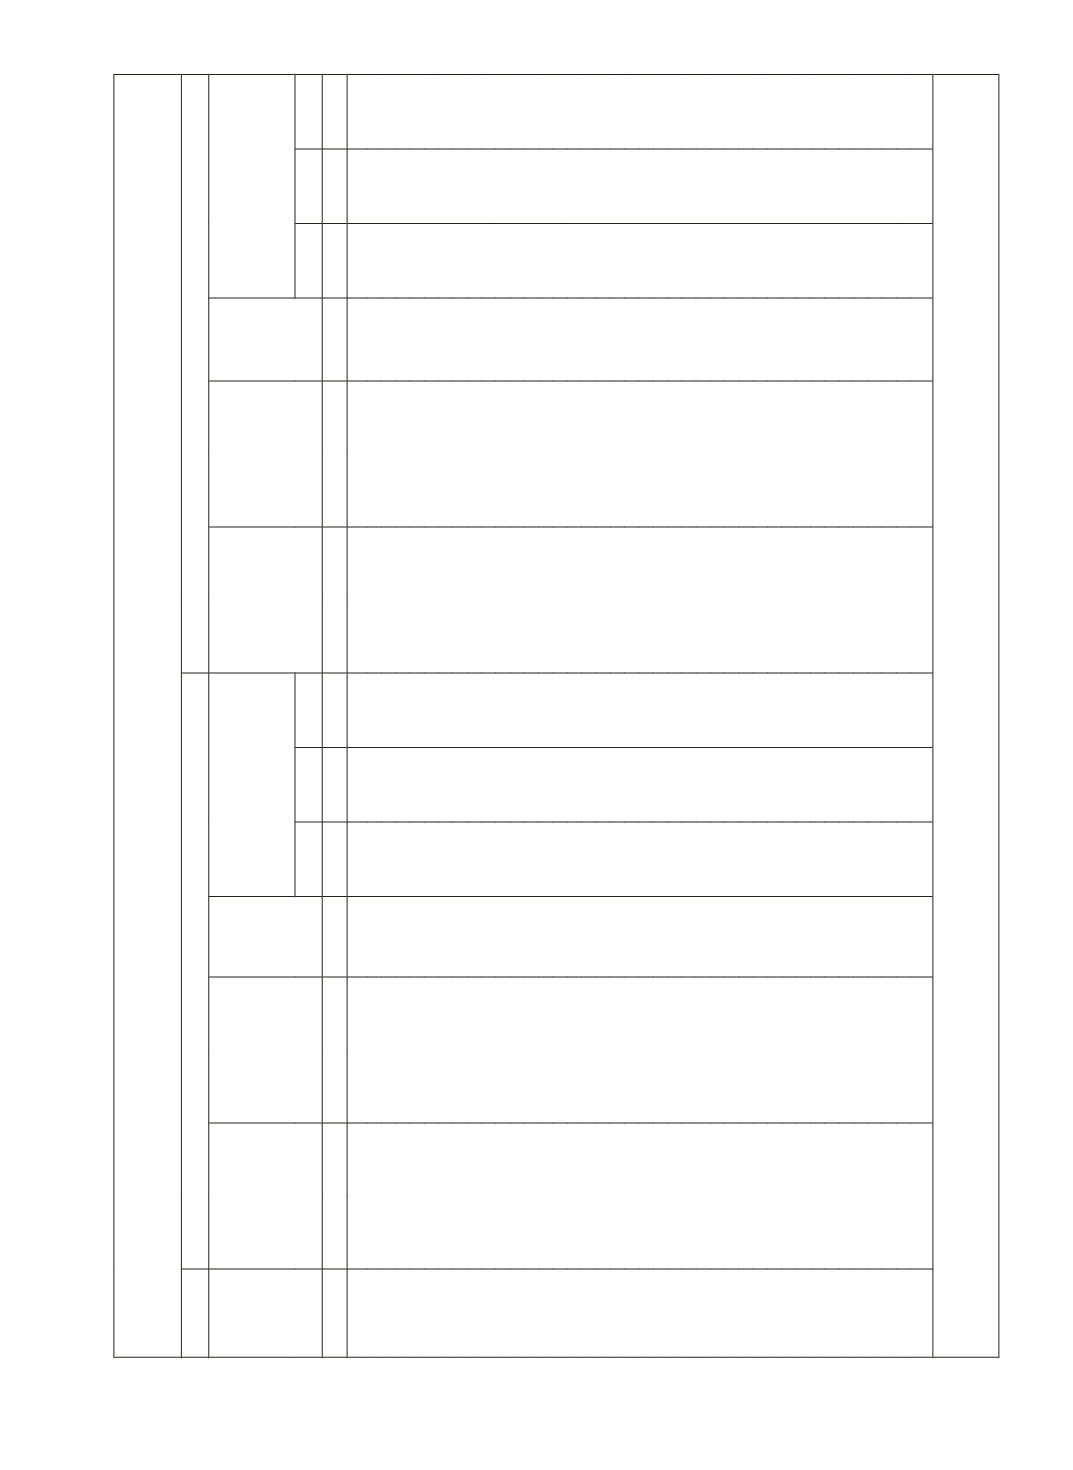
Annexure K : Direct Institutional Credit for Agriculture and Allied Activities - Share in
Aggregate Loan and Share in GDP in Agriculture and Allied Activities
Loans Issued (
`
crore)
Loans Outstanding
Year
Short-Term*
Long-Term*
Total
(Short+
Long
Term)
Per cent to GDP
originating from
Agriculture & Allied
Activities
Short-Term Long-Term
Total
(Short+
Long
Term)
Per cent to GDP
originating from
Agriculture & Allied
Activities
Short Long Total
Short Long Total
1
2
3
4
5
6
7
8
9
10
11
12
13
1970-71
589 (72.0)
229 (28.0)
818 3.2 1.2 4.4
-
-
-
1971-72
640 (72.5)
243 (27.5)
883 3.4 1.3 4.6 803 (43.0)
-
1865 4.2
9.8
1972-73
790 (68.4)
345 (29.9)
1156 3.8 1.6 5.5 860 (39.5)
-
2179 4.1
10.4
1973-74
859 (72.4)
327 (27.6)
1187 3.1 1.2 4.3 985 (41.0)
985 (41.0)
2405 3.6 3.6 8.7
1974-75
974 (70.0)
417 (30.0)
1391 3.2 1.4 4.6 1150 (42.2)
1150 (42.2)
2724 3.8 3.8 9.0
1975-76
1177 (70.3)
498 (29.7)
1675 3.9 1.7 5.6 1377 (43.8)
1772 (56.3)
3147 4.6 5.9 10.5
1976-77
1369 (67.2)
668 (32.8)
2037 4.5 2.2 6.7 1667 (43.6)
2160 (56.4)
3827 5.5 7.1 12.5
1977-78
1488 (69.0)
668 (31.0)
2155 4.1 1.8 6.0 1894 (42.9)
2520 (57.1)
4414 5.2 7.0 12.2
1978-79
1792 (67.9)
850 (32.2)
2641 4.8 2.3 7.1 2299 (44.1)
2908 (55.8)
5208 6.2 7.8 14.0
1979-80
1847 (63.1)
1082 (36.9)
2928 4.8 2.8 7.6 2814 (44.1)
3568 (55.9)
6382 7.3 9.3 16.6
1980-81
2047 (59.6)
1389 (40.4)
3436 4.2 2.9 7.1 3250 (43.1)
4289 (56.9)
7539 6.7 8.9 15.6
1981-82
2740 (63.8)
1556 (36.2)
4296 5.0 2.8 7.9 3792 (43.9)
4843 (56.1)
8635 6.9 8.9 15.8
1982-83
2759 (63.4)
1593 (36.6)
4352 4.7 2.7 7.4 3685 (38.1)
5995 (61.9)
9680 6.3 10.2 16.4
1983-84
3335 (63.6)
1909 (36.4)
5244 4.7 2.7 7.5 4339 (37.7)
7185 (62.4)
11524 6.2 10.2 16.4
1984-85
3731 (60.5)
2436 (39.5)
6167 4.9 3.2 8.1 5006 (36.6)
8670 (63.4)
13676 6.6 11.4 18.1
1985-86
4529 (63.3)
2629 (36.7)
7159 5.6 3.2 8.8 5858 (36.1) 10377 (63.9)
16234 7.2 12.8 20.0
1986-87
4512 (58.4)
3208 (41.6)
7720 5.2 3.7 8.9 6236 (34.9) 11645 (65.1)
17881 7.2 13.4 20.5
1987-88
5516 (60.0)
3682 (40.0)
9198 5.7 3.8 9.5 7342 (34.8) 13742 (65.2)
21084 7.6 14.2 21.8
1988-89
5884 (62.7)
3497 (37.3)
9381 4.9 2.9 7.8 8561 (36.0) 15239 (64.0)
23800 7.2 12.7 19.9
1989-90
6499 (61.1)
4129 (38.8)
10628 4.9 3.1 8.0 9527 (34.4) 18160 (65.6)
27687 7.2 13.7 20.9
1990-91
5979 (58.7)
4209 (41.3)
10188 3.9 2.7 6.6 10002 (34.1) 19313 (65.9)
29316 6.5 12.5 19.0
1991-92
6611 (57.3)
4588 (39.8)
11538 3.7 2.5 6.4 10419 (33.5) 20723 (66.5)
31142 5.8 11.5 17.3
1992-93
7665 (61.2)
4864 (38.8)
12530 3.8 2.4 6.2 11687 (34.1) 22576 (65.9)
34263 5.8 11.2 16.9
1993-94
9752 (65.0)
5261 (35.0)
15013 4.2 2.2 6.4 12952 (35.0) 24037 (65.0)
36988 5.5 10.2 15.8
1994-95
11932 (63.6)
6841 (36.4)
18773 4.4 2.5 7.0 14361 (35.3) 26378 (64.7)
40738 5.3 9.8 15.1
1995-96
15273 (64.5)
8419 (35.5)
23692 5.2 2.9 8.1 17793 (38.7) 28227 (61.3)
46020 6.1 9.6 15.7
1996-97
16956 (64.4)
9389 (35.6)
26345 4.8 2.7 7.5 20009 (39.3) 30911 (60.7)
50921 5.7 8.8 14.4
1997-98
18632 (65.0) 10024 (35.0)
28656 5.0 2.7 7.6 21469 (39.4) 32950 (60.4)
54518 5.7 8.8 14.5
1998-99
20610 (63.0) 12087 (37.0)
32697 4.8 2.8 7.6 23521 (41.0) 33886 (59.0)
57408 5.5 7.9 13.3
1999-00
29045 (63.8) 15968 (35.1)
45534 6.4 3.5 10.0 31659 (38.9) 49724 (61.1)
81383 7.0 10.9 17.9
2000-01
32355 (67.1) 15346 (31.8)
48187 7.0 3.3 10.5 37302 (40.7) 54352 (59.3)
91654 8.1 11.8 19.9
2001-02
38141 (70.4) 15612 (28.8)
54195 7.6 3.1 10.9 45234 (42.9) 60268 (57.1) 105502 9.1 12.1 21.2
2002-03
45288 (69.5) 19887 (30.5)
65175 9.3 4.1 13.4 54224 (44.0) 68905 (56.0) 123129 11.2 14.2 25.4
2003-04
59593 (71.4) 23834 (28.6)
83427 10.9 4.4 15.3 70454 (46.6) 80774 (53.4) 151228 12.9 14.8 27.8
2004-05
71748 (68.1) 33555 (31.9) 105303 12.7 5.9 18.6 86259 (45.1) 104791 (54.9) 191050 15.3 18.5 33.8
2005-06
94084 (65.3) 49938 (34.7) 144021 14.8 7.8 22.6 107988 (45.1) 131451 (54.9) 239439 16.9 20.6 37.5
2006-07 123072 (64.9) 66442 (35.1) 189513 17.0 9.2 26.2 132477 (46.3) 153436 (53.7) 285913 18.3 21.2 39.5
2007-08 136010 (69.8) 58943 (30.2) 194953 16.3 7.0 23.3 162596 (53.9) 139082 (46.1) 301678 19.4 16.6 36.1
2008-09 178639 (72.6) 67337 (27.4) 245976 18.9 7.1 26.1 198623 (55.6) 158908 (44.4) 357531 21.1 16.8 37.9
2009-10 225157 (75.6) 80705 (27.1) 297831 20.8 7.4 27.5 256256 (58.5) 181942 (41.5) 438198 23.7 16.8 40.4
* Total includes loans issued by State Governments For notes see Annexure M
Note:
Figures in brackets are percentages to respective aggregate (short+long) Loan
Source:
RBI (2012), Handbook of Statistics on the Indian Economy 2011-12


