204
amount of KCC loans
pari passu
with the higher numbers of credit cards. As
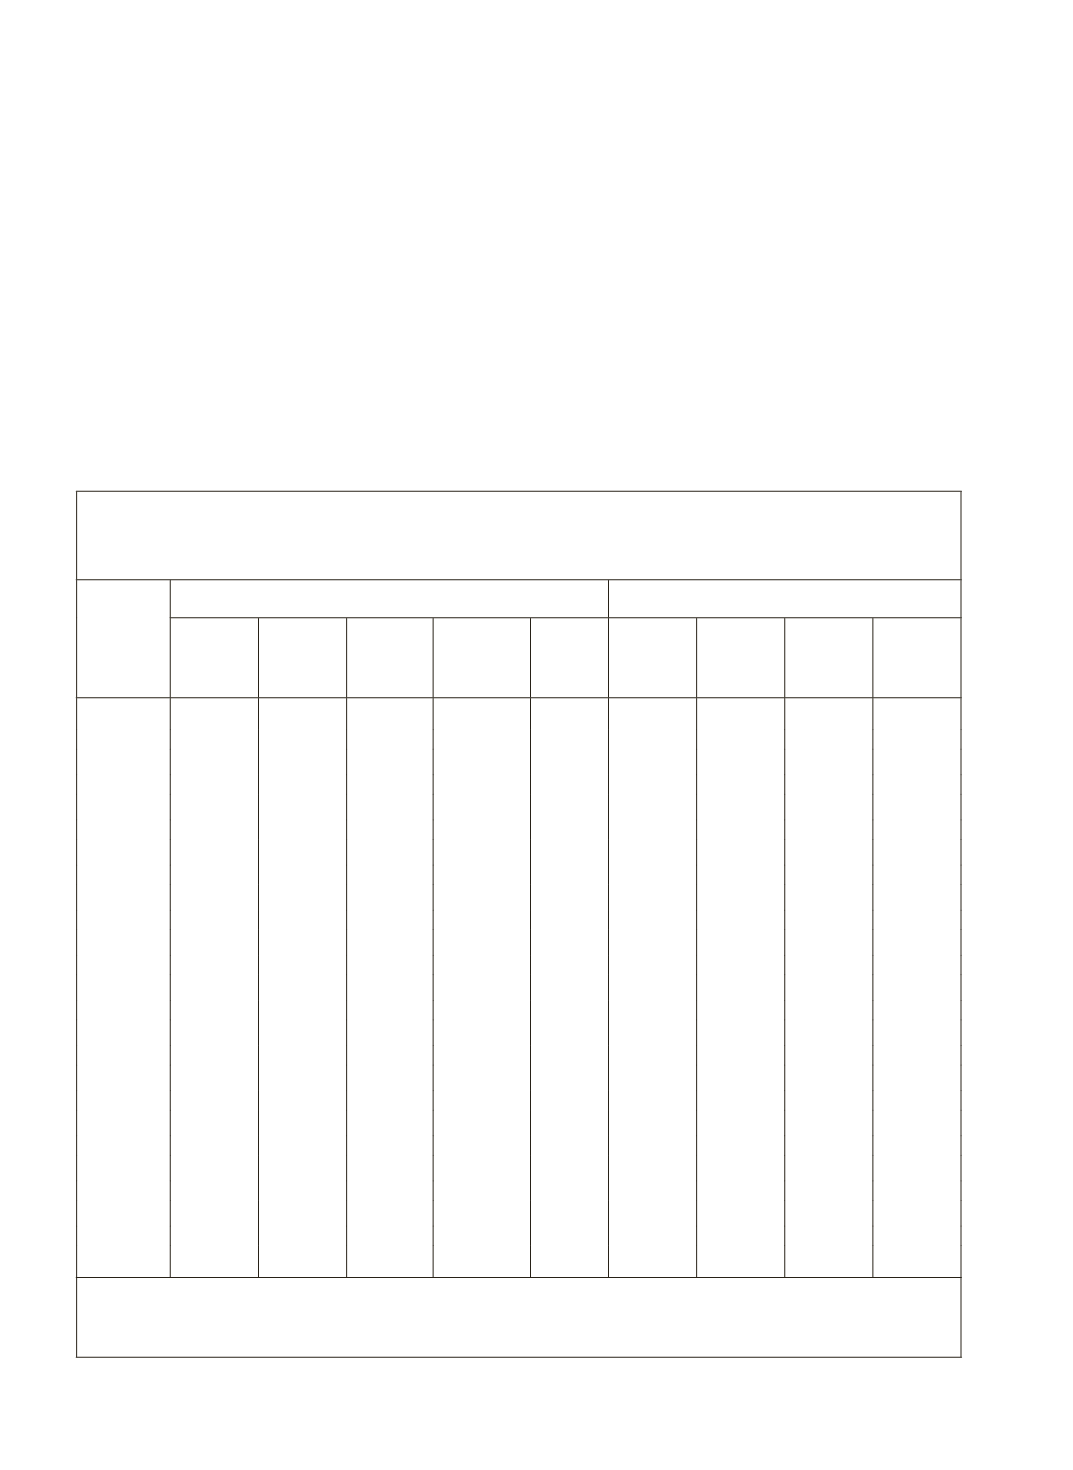
for the amount of credit flow under KCC, it appears interesting that despite a
growing share of crop loans in total agricultural credit, the share of credit flow
under KCC in total agricultural credit flow has tended to continuously fall until
2009-10; it has declined from 41.7% in 2001-02 to 15% in 2009-10 but only
fractionally edged up to 18% in 2011-12 (Table 7.2).
A major study which has been published probably after Bhaskaran’s
(2012) study, is a recent NABARD field research (Samantara 2010) undertaken
on a comprehensive basis covering 14 states in which a total of 1,876 KCC
holders from 178 bank branches from all the three bank agencies were selected.
The results brought out in this study too are truly illuminating and quite a
Table 7.2 : Total Flow of Credit to Agriculture and KCC Share:
2000-01 to 2010-12
(Amount in
`
Crore)
Year
Flow of Credit to Agriculture
Credit Flow under KCC
Coop-
erative
Banks
Regional
Rural
Banks
Com-
mercial
Banks
Other
Agencies
Total
Coop-
erative
Banks
Regional
Rural-
Banks
Com-
mercial
Banks
Total
2000-01 20712 4220 27807
82 52827 9412 1400 5615 16427
(45.4)
(33.2)
(20.2)
(31.1)
2001-02 23524 4854 33587
80 62045 15952 2382 7524 25858
(67.8)
(49.1)
(22.4)
(41.7)
2002-03 23636 6070 39774
80 69560 15841 2955 7481 26277
(67)
(48.7)
(18.8)
(37.8)
2003-04 26875 7581 52441
84 86981 9855 2599 9331 21785
(36.7)
(34.3)
(17.8)
(25.1)
2004-05 31231 12404 81481
193 125309 15597 3833 14756 34186
(49.9)
(30.9)
(18.1)
(27.3)
2005-06 39404 15223 125477
382 180486 20339 8583 18780 47702
(51.6)
(56.4)
(14.9)
(26.4)
2006-07 42480 20435 166485
- 229400 13141 7373 19786 40300
(30.9)
(36.1)
(11.9)
(17.6)
2007-08 48258 25312 181088
- 254658 19991 8743 19900 48634
(41.4)
(34.5)
(10.9)
(19.1)
2008-09 45966 26765 228951
226 301908 13172 7632 25865 46669
(28.7)
(28.5)
(11.3)
(15.5)
2009-10 63497 35217 285800
- 384514 7605.8 10131.7 39940.5 57678
(11.9)
(28.8)
(13.9)
(15)
2010-11 78007 44293 345877
114 468291 10719 11468 50438 72625
(13.7)
(25.9)
(14.6)
(15.5)
2011-12 86185 54239 368616
- 509040 10640 11520 69510 91670
(12.3)
(21.2)
(18.9)
(18.0)
CAGR(%)
14.0 27.3 29.2
24.9 -1.9 20.6 24.5 14.4
Note:
The figures within brackets are percentages to the total flow of credit.
Source:
RBI’s, Report on Trend and Progress of Banking in India and Nabard’s Annual Report, various
issues.


