52
in the RBI’s
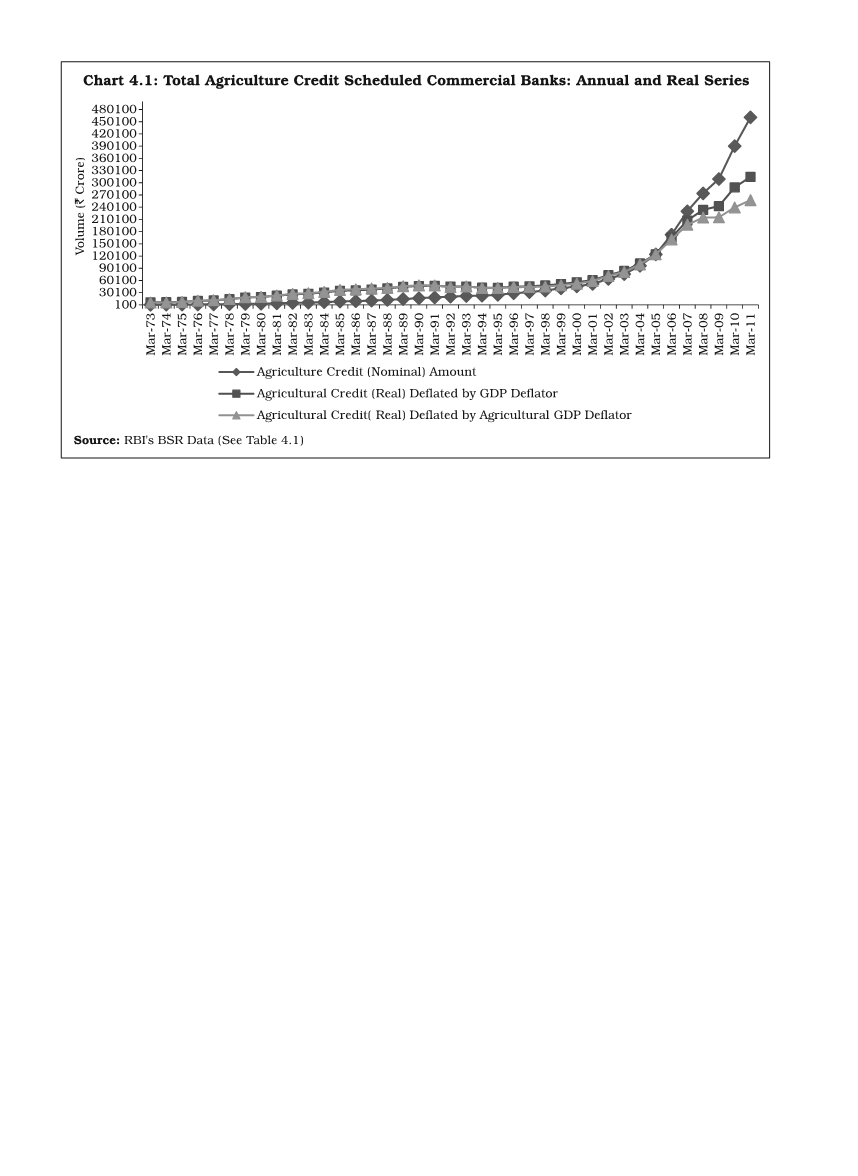
Basic Statistical Returns
(BSR). Based on these data, Table 4.1
and Chart 4.1 seek to portray annual trends in nominal and real agricultural
credit outstanding over the entire period. A cursory glance at the annual
series may give an impression of continuous increases in agricultural credit
uninterruptedly, which is true in nominal terms, for there has never been
any year of absolute decline in farm credit. But, there have been some years
when constant price series of bank credit have experienced absolute declines
essentially in the 1990s.
More significantly, a closer examination of the data series reveal
discernible breaks in the trend. Chart 4.2 and Table 4.2 bring out these
distinct patterns more succinctly. Broadly, there are four phases noticeable
in the time series: first, the post-nationalisation phase of high levels of annual
increases in agricultural credit throughout the 1970s and 1980s; second, a
sharp slowdown in the 1990s so much so with negative growth in some years;
third, a sharp pick-up and sizeable increases in the first half of the initial
decade of the current 21 century (2001-02 to 2006-07) after signs of social
revulsion surfaced against the phenomenon of severe financial exclusion in
the 1990s; and finally, signs of slowdown probably during the last four-year
period from 2007-08 as a reaction to large forced increases under the policy
of doubling of bank credit against agriculture effective from 2004-05 when
there has not been as generally perceived commensurate increase in the credit
absorptive capacity of the agricultural sector.


