144
S
tate
of
I
ndia
’
s
L
ivelihoods
R
eport
2015
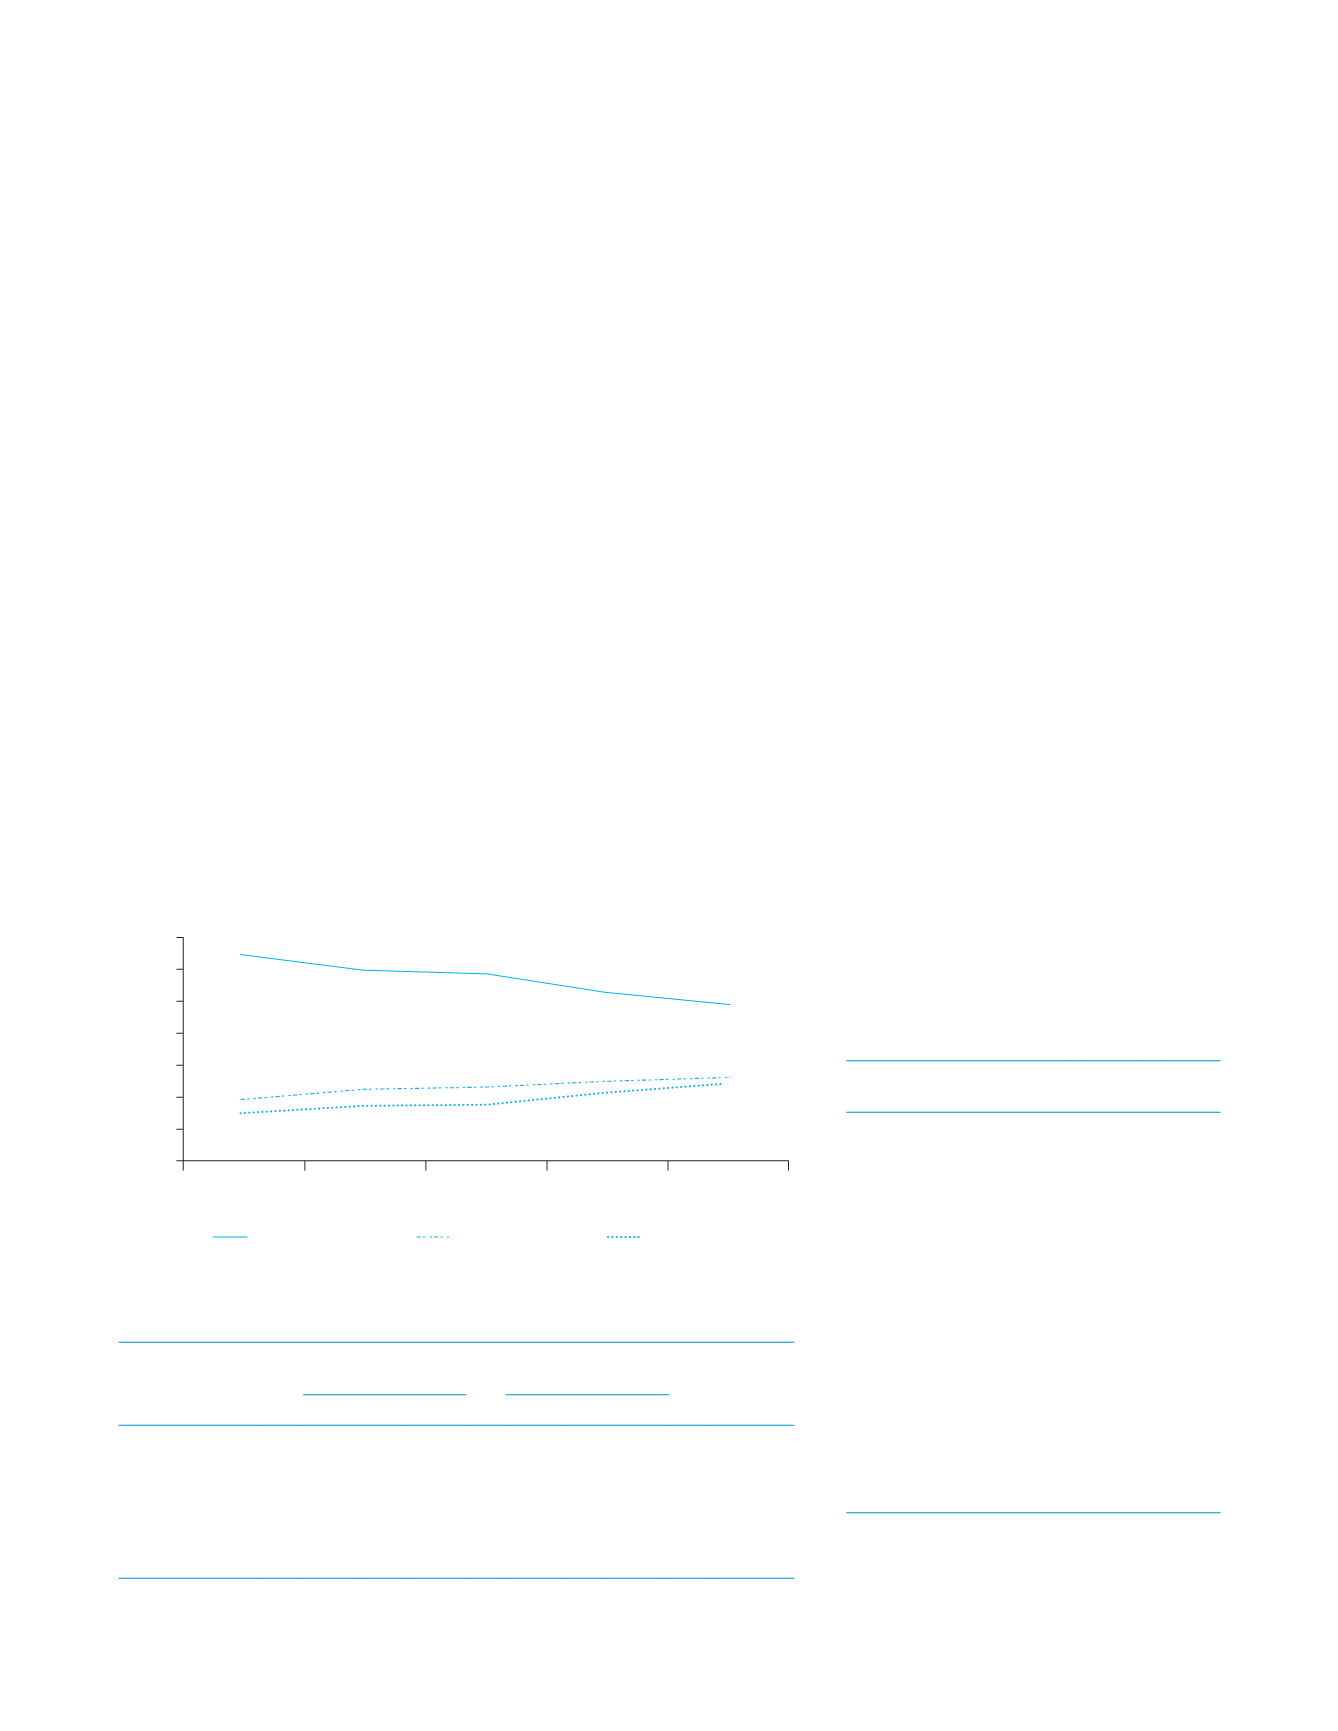
Figure 7.1:
Change in employment trends across sectors
Source:
Excerpted fromChapter 10,
The Economic Survey 2013–14
, Ministry of Finance, GoI, 2014.
Percent of workers
0
1993–94
Agriculture
Services
Industry
1999–2000
2004–05
2009–10
2011–12
10
20
64.8
19.7
15.6
17.4
18.1
21.5
24.3
22.7
23.4
25.3
26.8
59.8
58.5
53.2
48.9
30
40
50
60
70
The structural changes are reflected in
the employment-based livelihoods too. The
2011–12 survey on informal employment
brought out that 242 million people were
engaged in employment in non-agriculture
related activities which was more than those
employed in the agriculture sector. Themajor
industries in which people were employed
or engaged were trade hotel and restaurant
services, manufacturing, construction and
transportation, storage and communications
(Figure 7.1). The remaining sub-sectors such
as mining, education, insurance and health
had a much smaller share of people engaged
in livelihoods. In terms of percentage, 49
per cent of employment was in agricultural
sector, 13 per cent in manufacturing, 12
per cent in non-manufacturing and 27
per cent in services.
There had been a significant shift of
livelihoods from agricultural sector to
other-than-agriculture sector (Table 7.2).
Agriculture-based livelihoods accounted for
58.5 per cent of people employed in 2004–05.
By 2011–12, this declined to 48.9 per cent.
The non-manufacturing and the services
sectors had a share of around 30 per cent of
all livelihoods in 2004–05. In 2011–12, this
increased to 38.5 per cent. Manufacturing
sector increased the proportion of livelihoods
from 11.7 per cent to 12.6 per cent which
is a negligible increase. The growth rate in
jobs was the highest in non-manufacturing
sub-sectors, driven mostly by a booming
construction sector. Among services, trade,
transport, storage and communication sec-
tors registered a strong employment growth.
The change in nature of livelihoods is dis-
cernible and there is a distinct shift away
from agriculture to non-farm sector with
agricultural employment declining by 13.8
per cent in the seven year period from2005 to
2012.While agriculture shed about 37million
workers, non-farm sector createdmore than
51million jobs during the seven-year period.
But for growth of the non-farm sector, the
employment situation could have rendered
livelihoods unsustainable.
The 68th round of NSSO survey (Table
7.3) brought out that more workers are
Table 7.2:
Employment trends in farm and non-farm sectors
Sector
Number employed
(millions)
Share to total (%)
Growth rate
in jobs (%)
2004–05
2011–12
2004–05
2011–12
Agriculture
268.93
231.90
58.50
48.90
(–13.8)
Manufacturing
53.91
59.75
11.73
12.60
10.8
Non-manufacturing
29.41
55.25
6.41
11.65
87.9
Services
107.36
127.33
23.36
26.85
18.6
Total
459.61
474.23
100
100
3.2
Source:
NSSO surveys, various periods; Ministry of Statistics and Programme Implementation, GoI.
Table 7.3:
Informal workers employed by various
sector (%)
Sector
Rural
workers
Urban
workers
Agriculture
11.4
1.6
Mining and quarrying
1.2
Manufacturing
21.3
24.9
Construction
27.3
9.8
Wholesale and retail trade,
auto repairs
13.9
20.7
Transport, storage
7.1
7.8
Hotel and food service
2.2
4.0
Information, communication
2.7
Public admin, defence
1.9
4.3
Financial services
0.8
2.6
Education
5.1
5.8
Scientific, technical,
professional activities
0.4
1.7
Source:
Informal Sector and Conditions of Employment
in India 2011–12, NSSO 68th round, July 2014.
Note:
The data relates to wage labour and hence the
agriculture sector numbers are lower than others.


