Policy and Financing Framework for Livelihoods
17
been proposed is to be examined. Data
analysis for the years 2011–15 showed that
on an average, the states spent between 35
per cent to 40 per cent on social sector pro-
grammes. If the states continued to allocate
funding at the normal current proportion
for social sector, it would have been around
40.5 per cent of their total budget as was
seen in the year 2014–15. At this level, the
incremental spending on social sector by
the states, based on the additional resources
devolution would be an increase of 0.12
per cent of GDP. But the decline in the central
government’s budget for the concerned sec-
tors is of the order of 0.24 per cent of GDP.
2
In net terms, the shifting of burden of devel-
opment programmes related to livelihoods
and social security to states is likely to result
in lesser expenditure and thus lesser develop-
ment impact, at least in the short term. Two
important schemes were spared the Finance
Minister’s axe. These are the food subsidy
scheme (under the NFSA) and the NREGS
(under NREGA). Neither of these two
schemes could be passed on to the states nor
the funding could be reduced on account
of the statutory nature of the schemes as
they are born out of central legislation. A
detailed assessment of the current position
of implementation of these two statutory
programmes is carried in the next chapter.
The Budget also mentions the key
approaches to be followed in strategising
the reforms and the consequent growth
impetus.
Economic Survey 2014–15
says,
“Wiping every tear from every eye also
requires proactive support from the govern-
ment in the formof a well-functioning, well-
targeted, leakage-proof safety net that will
provide bothminimum income and protect
against adverse shocks.” This is also true in
rural India where economic conditions for
farmers and labourers are under stress. The
policy issue, according to the
Survey
, is no
longer ‘whether’ but ‘how’ best to provide
and protect. Continuing its emphasis on
the need to achieve growth, the
Survey
states that economic growth is good for the
poor because it raises the income directly
and generates resources to invest in public
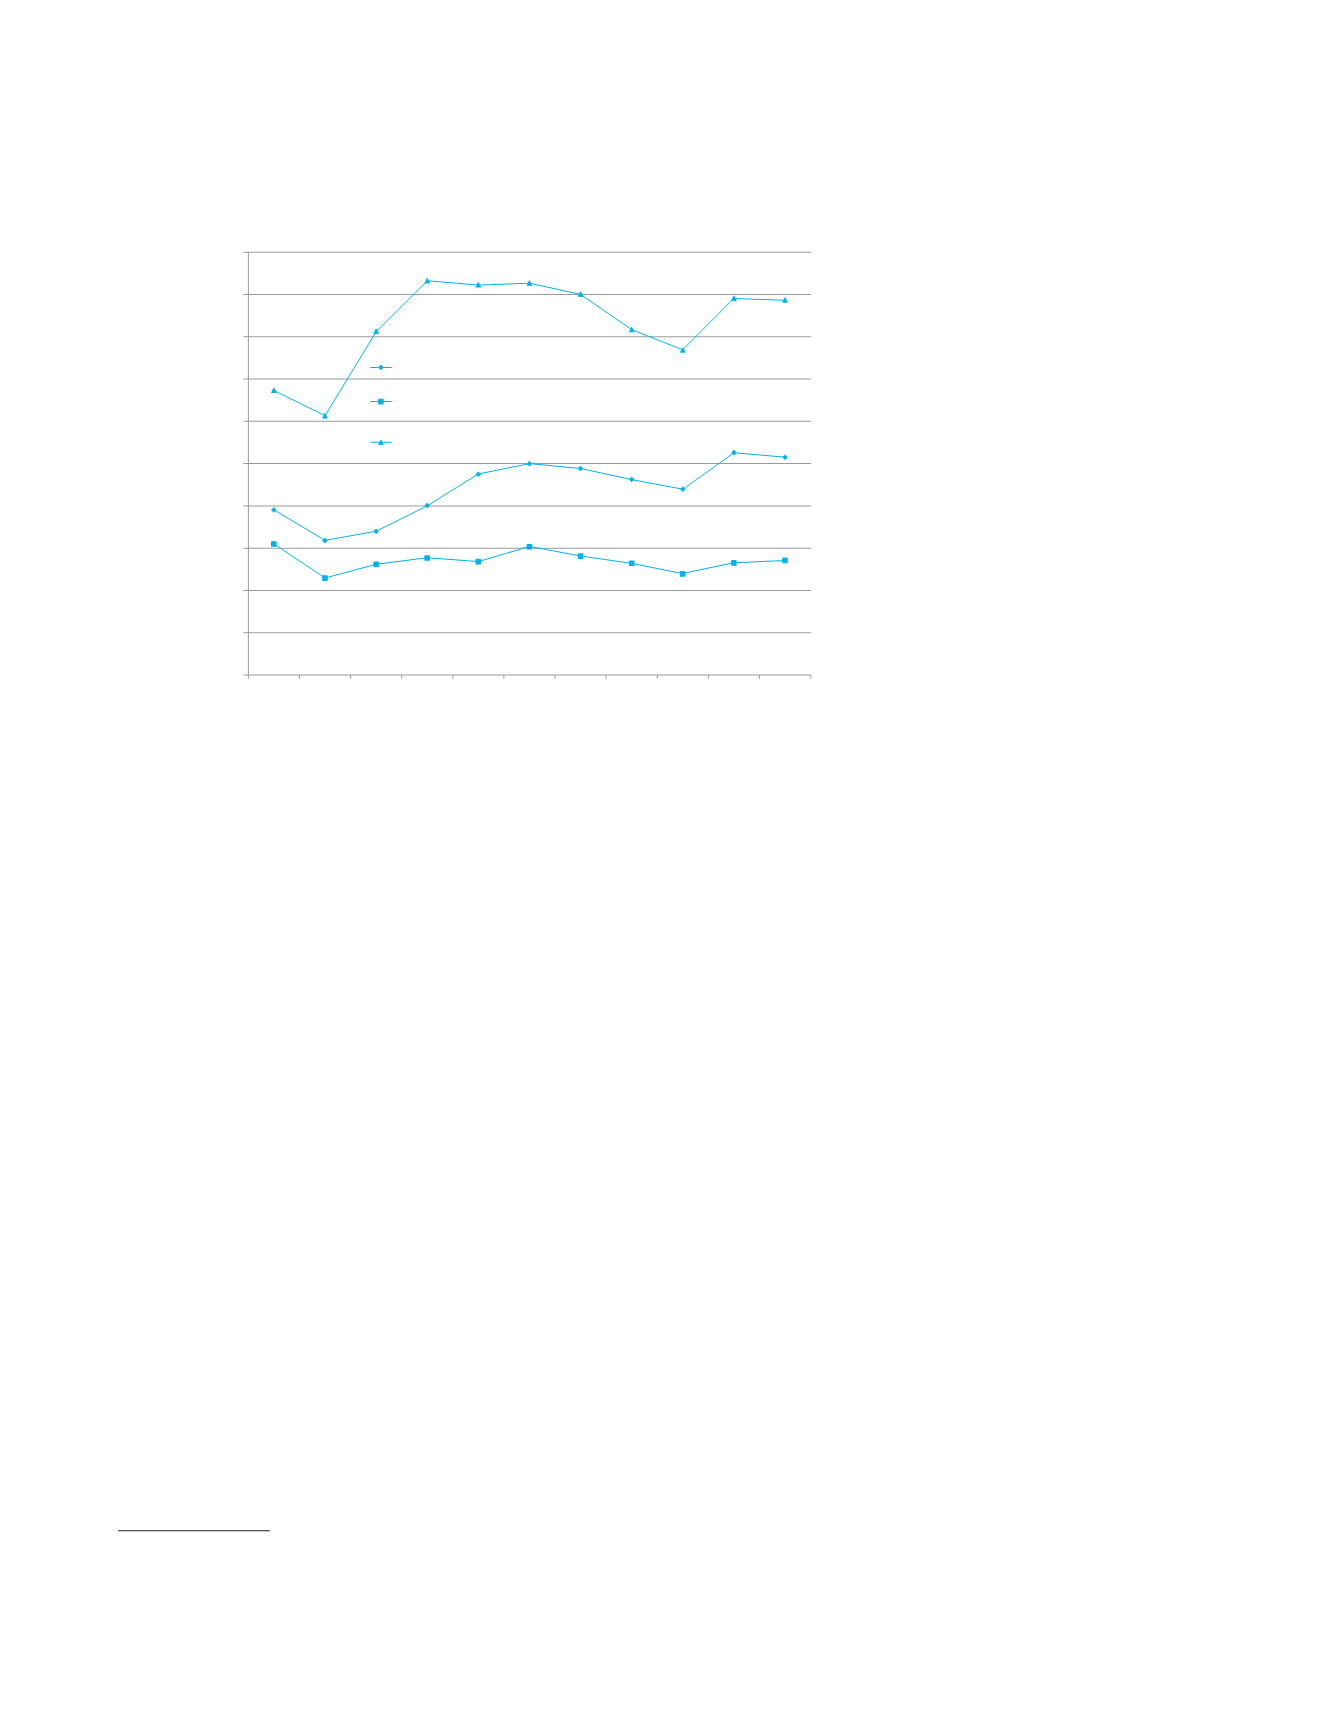
Figure 2.1:
Budget expenditure on agriculture and rural development
Source:
Authors’ working based on data from Indian Public Finance Statistics, Ministry of Finance, GoI and CSO
data on GDP.
0.00%
1.00%
2.00%
3.00%
4.00%
5.00%
6.00%
7.00%
8.00%
9.00%
10.00%
1990–91
2000–01
2005–06
2006–07
2007–08
2008–09
2009–10
2010–11
2011–12
2012–13
2013–14
Expenditure on agriculture as % of agricultural GDP
Expenditure on agriculture and rural development as % of GDP
Expenditure on agriculture & irrigation as % of agri GDP
2
Based on ‘Of Bold Strokes and Fine Prints’, Analysis
of Union Budget 2015–16, Centre for Budget and
Governance Accountability (CBGA), 2015.


