Dairy-based Livelihoods
55
•
Contribution of livestock, especially
dairying, to family income ranges from
20 per cent to 50 per cent and poorer the
family, greater is the contribution.
Dairying is a livelihood option for those
who hold limited land. The NSSO survey
data clearly establishes the fact that those
in livestock farming are likely to have
much less land than those engaged in crop
cultivation. In other words, dairy farming
is the key livelihood for more vulnerable
households.
II. Emerging demand–supply
imbalances
The growth rate of milk production varied
from an average of 4.3 per cent per annum
in the 1990s to 3.7 per cent per annum in the
2000s, achieving five per cent growth in the
years 2010–11 and 2011–12 but fell to 3.5
per cent and 3.9 per cent during 2012–13 and
2013–14. Buffaloes and cows contribute 51
per cent and 45 per cent of the total milk pro-
duction respectively (Figure 4.1). Production
in top milk-producing states such as Uttar
Pradesh, Andhra Pradesh and Rajasthan is
largely contributed by buffaloes’ milk. Tamil
Nadu is the largest producer of cow’s milk,
having 11 per cent share of the total cow’s
milk in the country out of which 89 per cent
is produced by cross-bred and exotic cows.
Indigenous milch cattle (48 million)
and milch buffaloes (51 million) make up
for 82 per cent of the country’s total milch
population, in contrast to the cross-bred
cows (19.5 million) at 18 per cent.
While livestock population has been
declining, milk production has been
increasing (Table 4.2). While this can be
due to improvements in the productivity
of animals and culling of non-productive
animals, there are some apprehensions that
the enhanced production figures may be
due to adulteration of milk.
Domestic demand for milk and milk
products continues to grow, spurred by
rising incomes and changing food prefer-
ences. According to the Government of
India estimates, milk demand is projected
to grow to at least 180 million tons by
2021–22. Meeting this demand from
domestic supply would require production
to grow at 5.5 per cent per annum. If India
fails to achieve substantial production
growth, the country would need to resort
to significant imports from the world mar-
ket which has the potential to cause prices
to spurt since India is a large consumer.
Hence, increasing milk production and
improving productivity of dairy farmers
to meet the projected domestic demand
is a key development challenge facing the
Indian dairy sector.
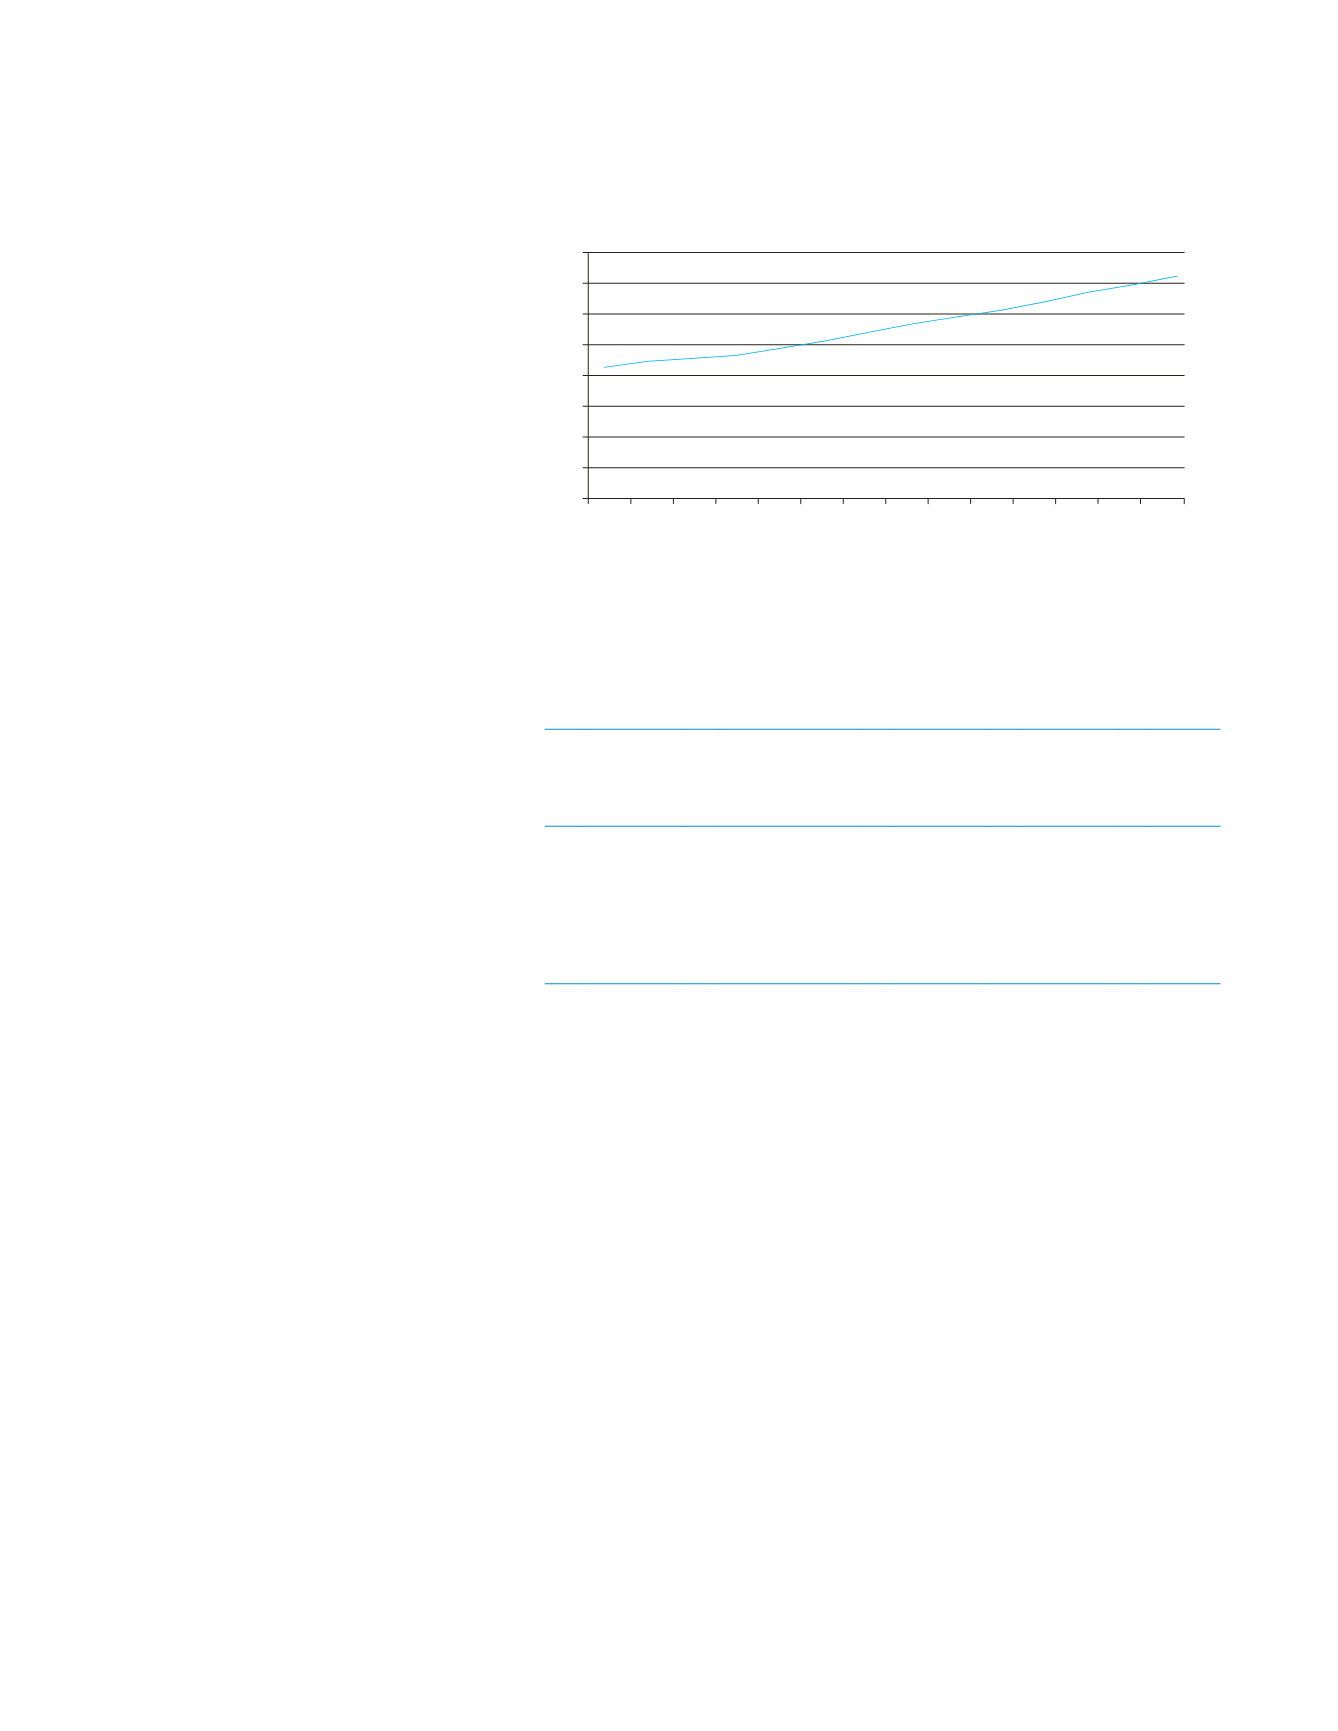
Figure 4.1:
Milk production trends
Source:
Basic Animal Husbandry and Fisheries Statistics 2014, Department of Animal Husbandry,
Ministry of Agriculture, GoI.
80.6 84.4 86.2 88.1 92.5 97.1 102.6 107.9 112.2 116.4 121.8
127.9 132.4
137.9
0
20
40
60
80
100
120
140
Milk production (Million tons)
160
2000–01
2001–02
2002–03
2003–04
2004–05
2005–06
2006–07
2007–08
2008–09
2009–10
2010–11
2011–12
2012–13
2013–14
Table 4.2:
Livestock population
S.
No. Species
Livestock census
2003 (no. in
millions)
Livestock
census 2007
(no. in
millions)
Livestock
census 2012
(no. in
millions)
Growth
rate (%)
2007–12
1.
Cattle
185.2
199.1
190.9
–4.10
2.
Buffalo
97.9
105.3
108.7
3.19
3.
Yaks
0.1
0.1
0.1
–7.64
4.
Mithuns
0.3
0.3
0.3
12.88
Total Bovines
283.4
304.8
300.0
–1.57
Source:
Annual Report 2014–15, Department of Animal Husbandry, Dairying & Fisheries; Ministry
of Agriculture, Government of India.


