bu i ld i ng an i nc lu s i ve f i nanc i a l s e ctor i n i nd i a
89
Chhattisgarh, Maharashtra and Assam experienced con-
tinuous growth in SHG loan outstanding from 2010–11
to 2013–14.
4.3.5 Non-performing Assets
NPAs as percentage of loan outstanding were the highest
inMadhya Pradesh on 31March 2012 (22.4 per cent) and
31 March 2013 (21.2 per cent) and remained at 19.31
per cent on 31 March 2014. NPAs as percentage of loan
outstanding were the highest in Uttar Pradesh (20.07 per
cent) and the least in West Bengal (6.63 per cent) as on
31 March 2014 as compared to the national average of
6.83 per cent. NPAs in Bihar and Assam remained below
8 per cent as on 31 March 2013 and 31 March 2014 but
increased in Chhattisgarh to 12.44 per cent on 31 March
2014 from 8.19 per cent a year earlier.
Overall, the picture that emerges for the year 2013–14
in respect of the SBLP is similar to that prevailing in the
previous year which suggested a deepening of credit flow
to a more limited number of SHGs in selected regions. It
would appear that banks are lending to well-established
SHG clients in the leading states while holding back
in other states and regions where the SHG movement
does not enjoy strong institutional support. Reports con-
tinue to be received of the reluctance of banks to lend
to SHGs even of well-established SHPIs. In some states
where NRLM activity has progressed disbursements
have picked up slightly. However, the impact of the pro-
gramme in terms of financial inclusion through SHGs
is obviously limited to the districts covered. Indeed, the
weak performance in some of the relatively backward
states and in the north and north-east region, which are
virtually falling off the map, needs to be fully understood
and tackled on an urgent basis.
4.4 PERFORMANCE OF BANKS IN
SHG LENDING
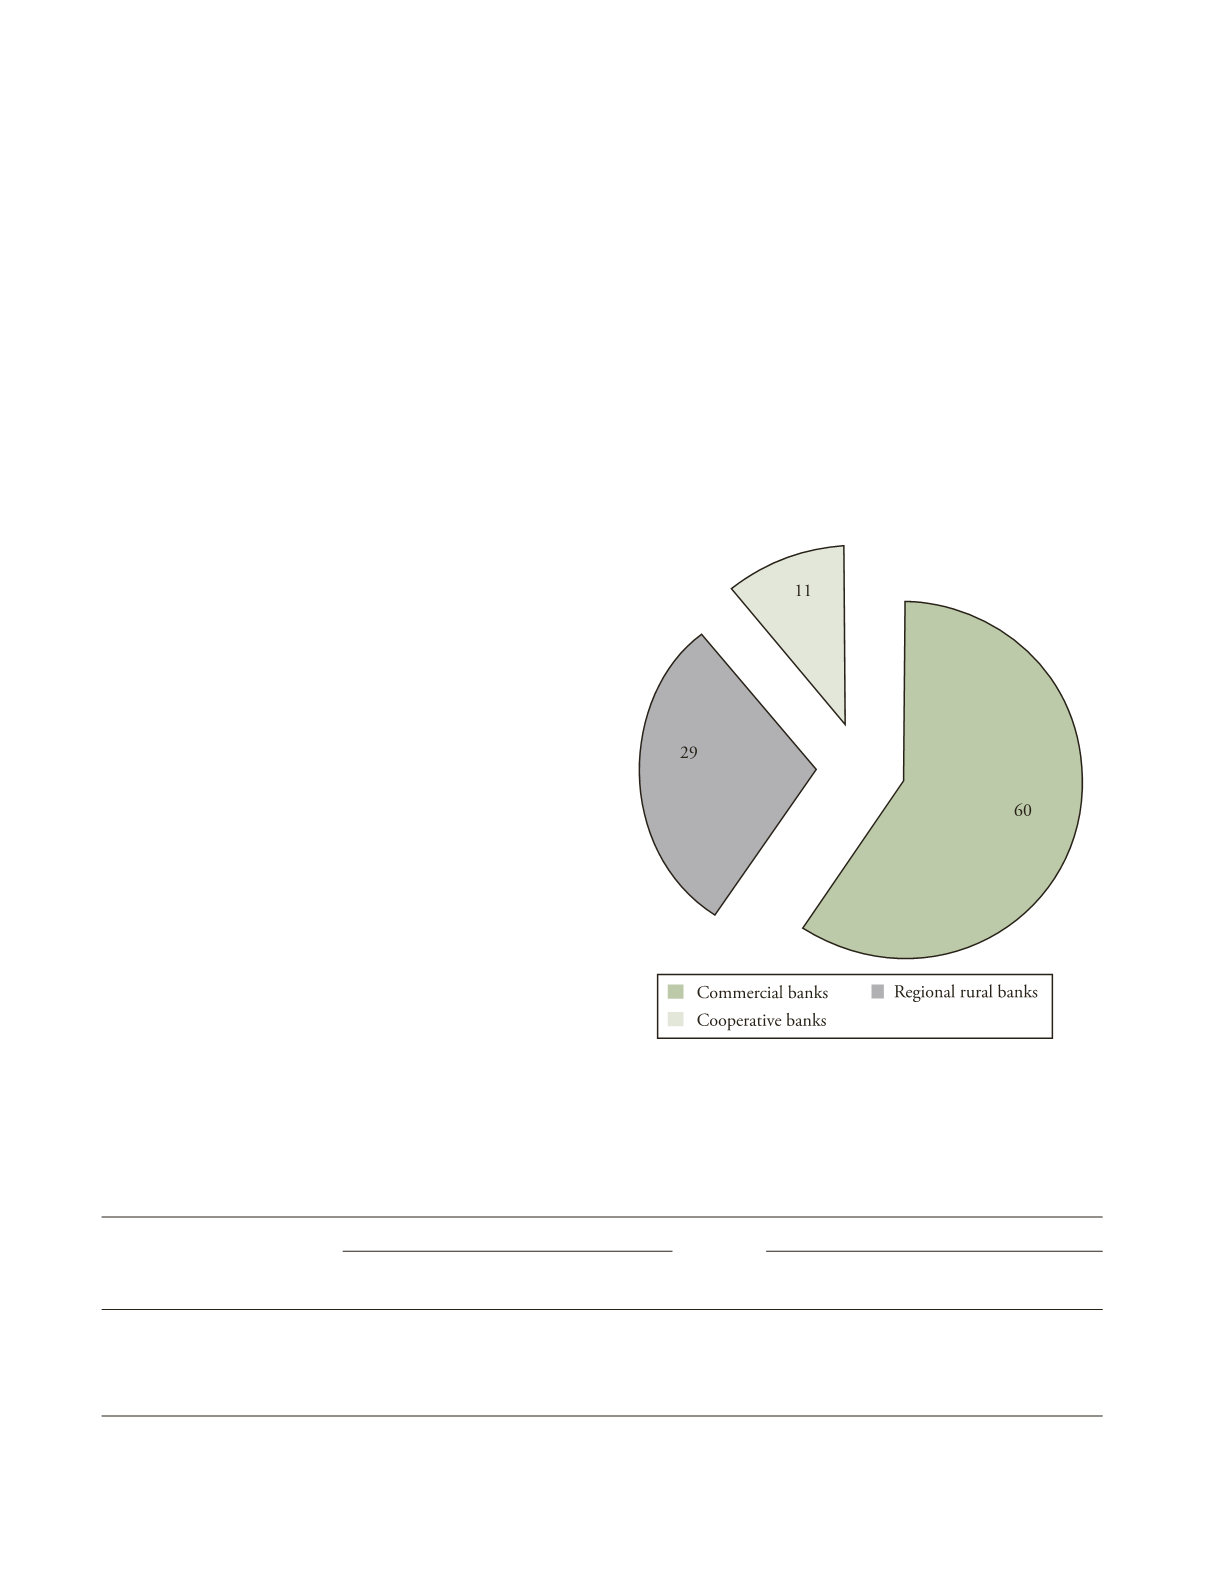
The number of SHGs with loan outstanding from banks
as on 31 March 2014 was 4.20 million, down by about
254,000 over the previous year (Table 4.9). There has
not been any change in the percentage share of difference
agencies—commercial banks (60 per cent), RRBs (29
percent), cooperative banks (11 percent) (Figure 4.6).
Thus the decline in the number of SHGs was more or
less equally shared between the different types of banks.
T
ABLE
4.9
Number of SHGs and Loan Outstanding by Agency
Banks
As on 31 March 2013
As on 31 March 2014
No. of SHGs
Loan outstanding
No. of SHGs
Loan outstanding
(Rs. billion)
(Rs. billion)
Commercial banks
2,643,971
266.4
2,501,264
293.9
Regional rural banks
1,327,367
105.2
1,227,563
110.5
Cooperative banks
480,096
22.1
468,511
24.9
Total
4,451,434
393.8
4,197,338
429.3
Source
: SHG data from NABARD (2013 and 2014).
F
IGURE
4.6
Agency-wise Distribution of Number of SHGs
with Outstanding Loans
Source
: NABARD (2014).


