bu i ld i ng an i nc lu s i ve f i nanc i a l s e ctor i n i nd i a
83
previous year was probably on account of the weeding
out of inactive accounts by the commercial banks. In
keeping with the observed phenomenon of stagnation,
the number of SHGs savings-linked to banks has not
picked up during the past one year.
The total savings amount seems to have picked up
momentum again in 2013 after a blip in 2012 (Figure
4.3) to reach Rs. 99 billion in 2014. SHG savings as
a proportion of bank loans outstanding to SHGs has
been steadily growing. SHG savings now constitute over
23 per cent of outstanding loans—up from a little over
20 per cent in the previous year.
This means that funding from SHG groups themselves
accounts for nearly a quarter of the SHG lending port-
folio of banks. It is also illustrative of the fact that SHGs
have emerged not only as recipients of bank loans but
also important contributors to resources being mobilized
by banks. It is widely accepted that savings deposits are
being used by banks as collateral for the loans given
to SHG members. Besides, banks have been reported
to be recovering overdue loans from savings accounts
of SHGs.
Data on state-wise performance of SHG savings with
banks is given in Appendix 4.1. While the number of
SHGs accounts increased only marginally between
March 2013 and March 2014, most of the states have
registered reasonable increases in the amount of bank
savings of SHGs. The exceptions among the major SHG
states are Karnataka, Bihar and Gujarat where there has
been a small decline in savings of SHGs. However, sub-
stantial declines have been registered in the northern and
north-eastern states both in SHG numbers and amount
of savings, a development which merits more serious
investigation.
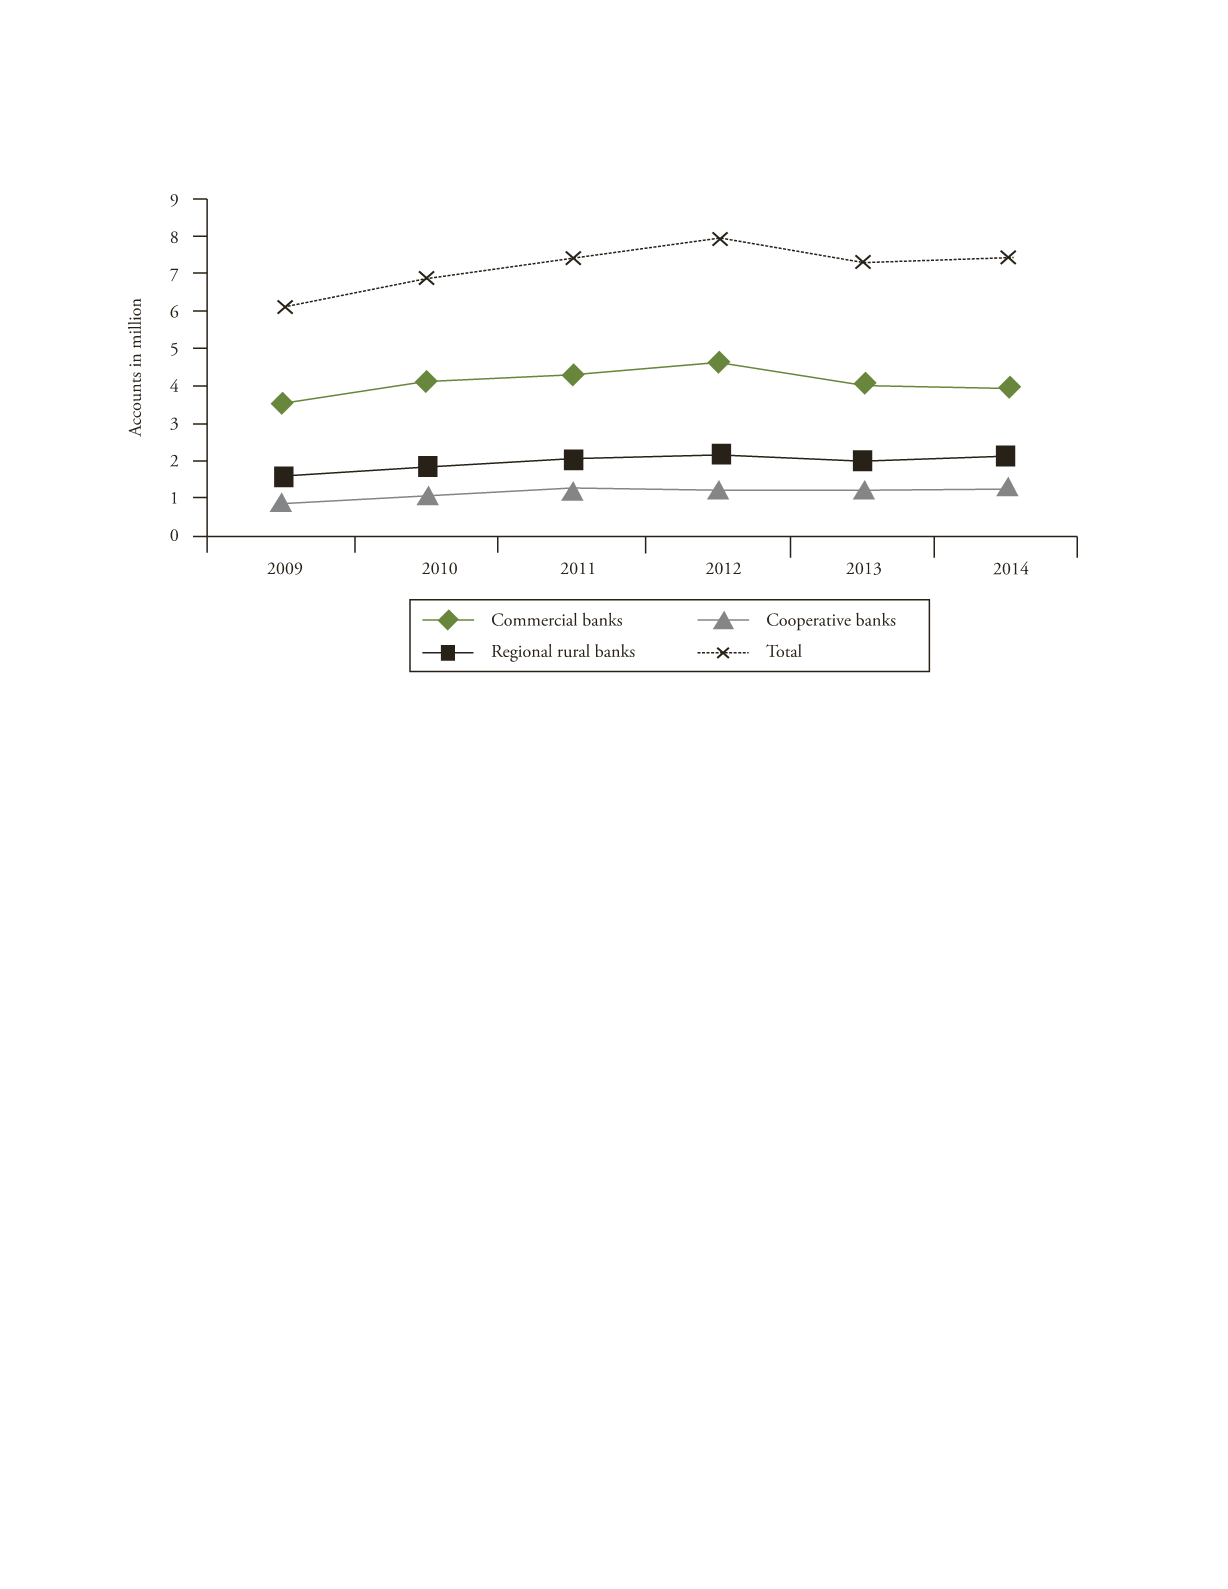
Among the financing agencies, commercial banks
continued to have the leading share (54 per cent) in the
number of SHGs with savings accounts, followed by
RRBs (28 per cent) and cooperative banks (18 per cent).
There has been no significant change over the years in the
share of these agencies (Figure 4.4).
In terms of the amount saved by SHGs as on 31 March
2014 with different agencies, 67 per cent was accounted
for by commercial banks, 20 per cent by RRBs and 13
per cent by cooperative banks (Figure 4.5 and Table 4.4).
Over the years there has been a steady increase in the
share of commercial banks, at the expense of cooperative
banks, while RRBs have roughly maintained their rela-
tive share.
F
IGURE
4.2
Number of SHGs Holding Savings Accounts 2009–2014
Source
: NABARD (2009 to 2014).


