i nc lu s i ve f i nanc e i nd i a re port 2014
82
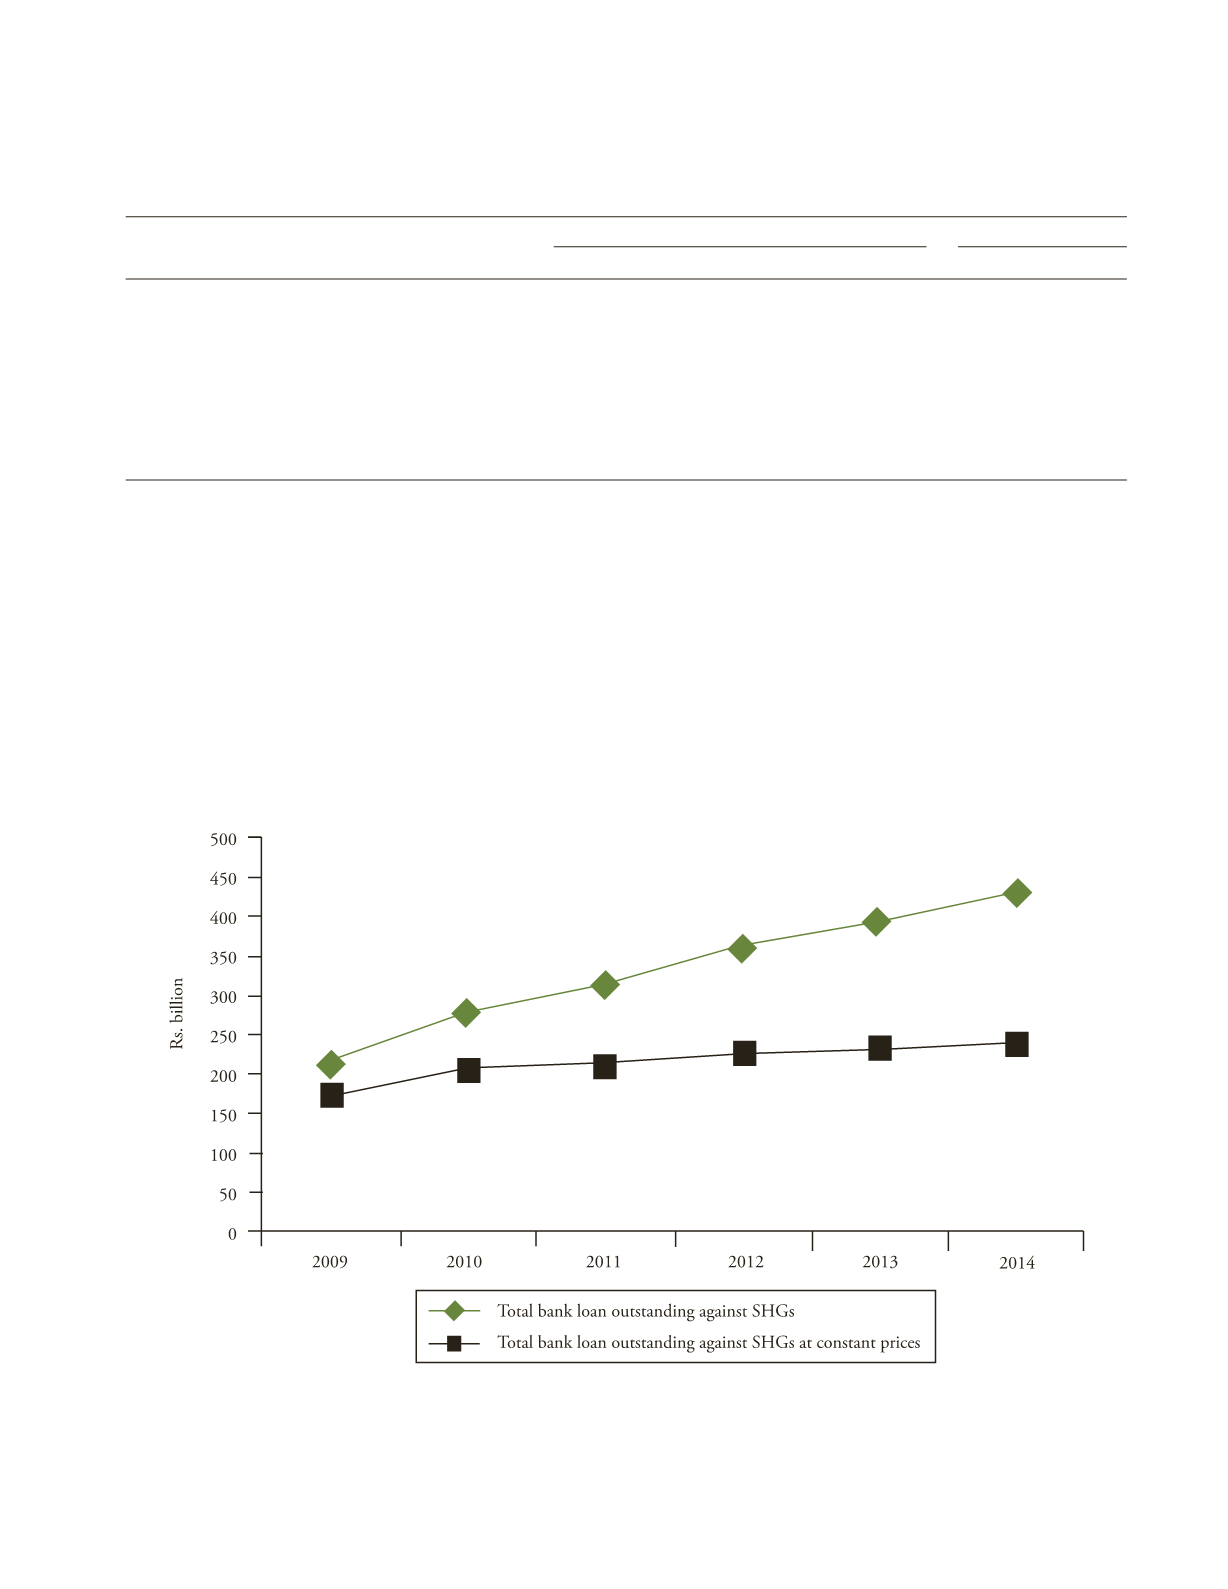
If we consider the loan outstanding from banks to
SHGs for the same period (2010–14) in real terms (Figure
4.1), the annual increase during the four years has been
less than 4 per cent from Rs. 205.7 billion to Rs. 238.1
billion, that too in a period of rising NPAs. Overall, a
clear break has set in in performance of SHGs around
2010 during which period the number of SHG clients of
the banking system have declined by 13 per cent.
4.1.2 Savings Performance
The number of SHGs savings-linked with the banking
system has grown steadily from 2007 since when records
are available, and had peaked at 7.96 million groups in
2012. The number declined to 7.3 million as at the end
of March 2013 (Figure 4.2) before increasing marginally
to 7.4 million in March 2014. The decline in the
T
ABLE
4.3
Financial Performance of SBLP
Indicator
% Change
CAGR (%)
2010–11
2011–12
2012–13
2013–14
2010–14
2006–10
Savings of SHGs with banks (Rs. billion)a
13.2
–6.7
25.4
20.5
12.4
26.9
Volume of loans disbursed to SHGs during the year#
0.7
13.7
24.5
16.7
13.5
33.8
(Rs. billion)
of which under SGSY/NRLM/other govt.
12.8
6.6
–16.5
57.7
12.2
16.25
programmes (%)
Bank loans outstanding with SHGs (Rs. billion) (a)
11.4
16.4
8.4
9.0
11.2
31.3
a
of which under SGSY/NRLM/other govt.
25.2
2.9
6.7
18.4
13.0
24.2
a
programmes (%)
Source
: NABARD (2010 to 2014).
Note
:
a
For the period 2007–10.
F
IGURE
4.1
Loan Outstanding to SHGs: Nominal and Real Terms
Source
: NABARD (2009 to 2014).


