i nc lu s i ve f i nanc e i nd i a re port 2014
70
liberalizing India were ‘financially excluded’ due to lack
of supply of consumption credit. The new technology
of credit card provided them with hassle-free consumer
finance, which they could not access from mainstream
banks directly. About seven years later was introduced
the technology of automatic teller machines or ATM.
It took another 10 years for internet banking to be
launched. Mobile banking was the last major technology
introduction.
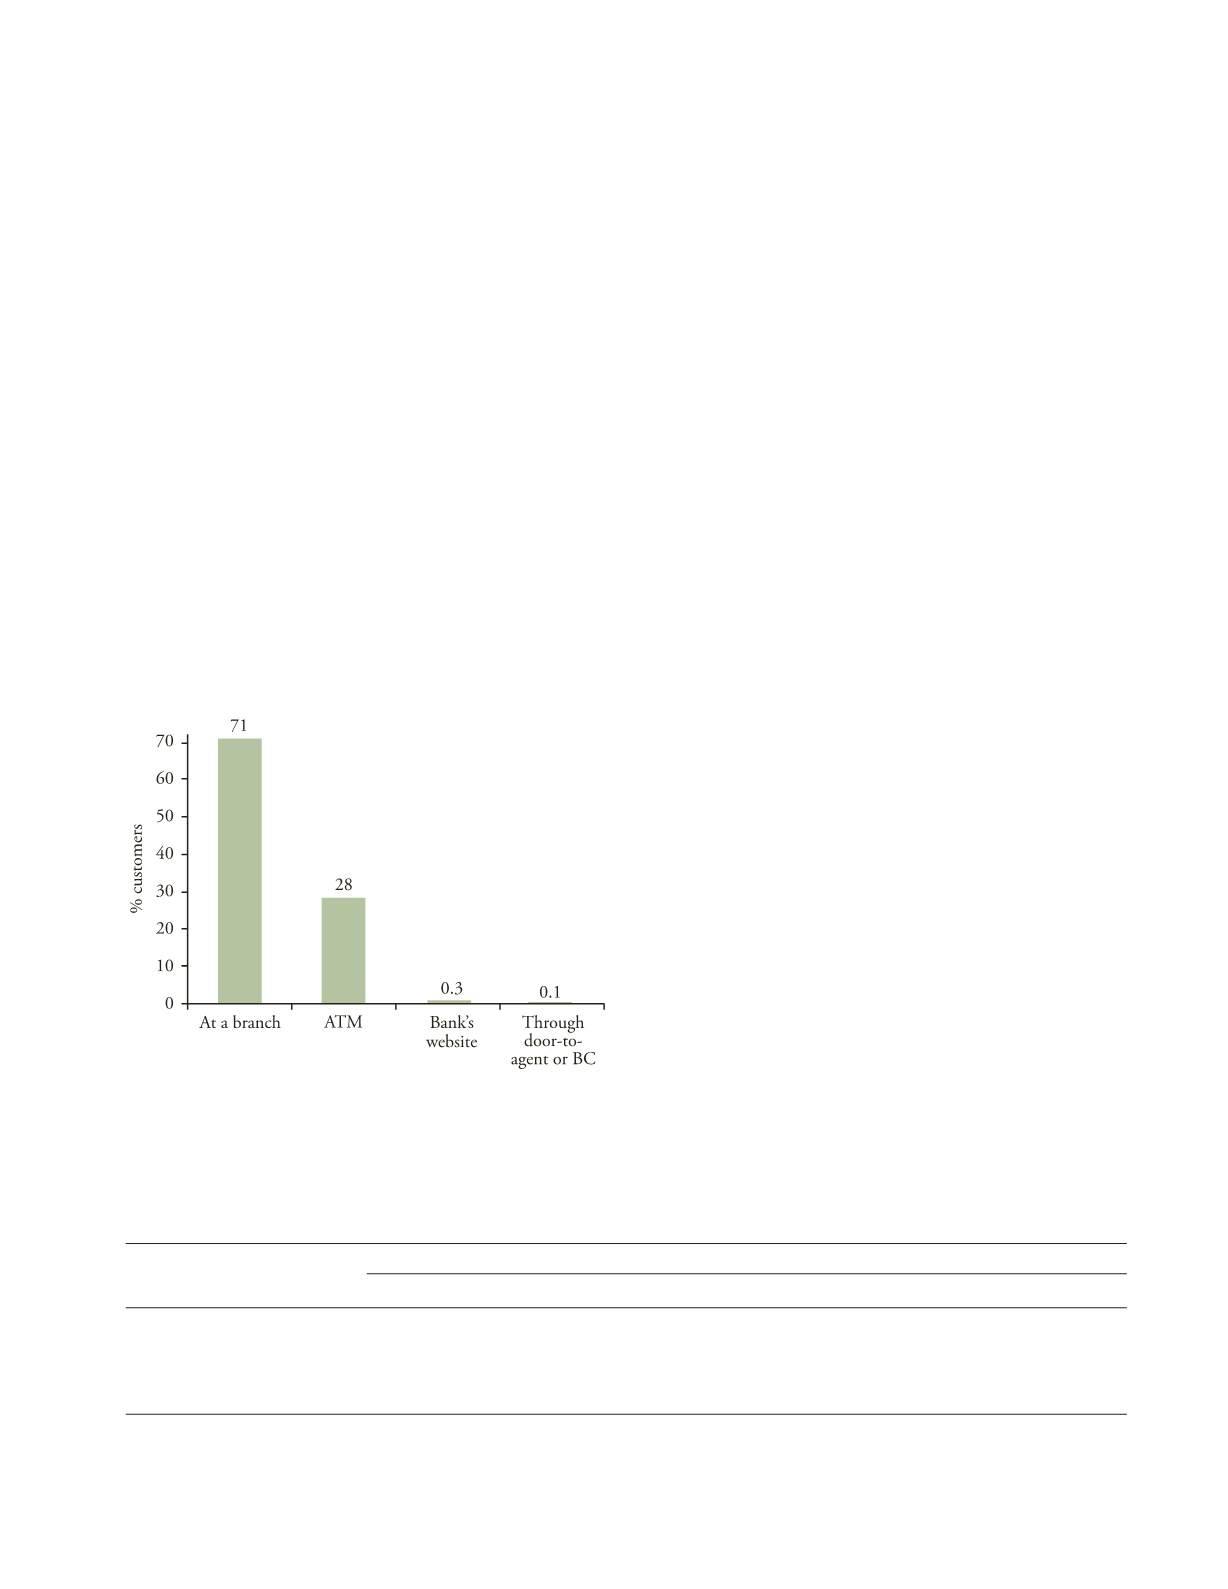
To what extent has the adoption of new technolo-
gies helped broadbase access to banking? The recent
InterMedia India Survey (2014) has made some pertinent
observations regarding the use of digital financial services
by customers. As Figure 3.4 shows a bank branch is still
the preferred place for majority of the bank custom-
ers. Interestingly, in the 28 years of its existence, ATM
technology could convince only 28 per cent of the active
customers to engage with the technology.
F
IGURE
3.4
Mode of Accessing Banking Services by Active Bank
Account Holders
Source
: InterMedia (2014).
National Payments Corporation of India (NPCI) set
up in 2009 operates the National Financial Switch (NFS)
that facilitates routing of ATM transactions through
interconnectivity between the banks’ switches thus
allowing the customers to use any ATM of a connected
bank. In June 2012 the RBI issued guidelines for non-
banking entities to set up White Label ATMs (WLA)
under the Payments and Settlement Systems Act 2007
with a view to enhance the spread of ATMs in semi
urban and rural areas where bank-owned ATMs are not
working (RBI, 2013–14). NFS has 83 direct members,
196 members, 49 RRB members and 7 WLA operators,
who together operate 1,80,494 ATMs in the country. The
WLAs operate about 4,370 ATMs, 60 per cent of which
are owned by Tata Communications Payment Solutions
Private Limited.
The available data suggests that banks have not found
the ATM technology viable for rural areas. Of a total of
1,60,055 ATMs in the country as of 31 March 2014 only
14 per cent (i.e., 23,334) are located in rural areas. The
metropolitan and urban areas accounted for about two-
thirds of the increase in the number of ATMs between
September 2012 and March 2014. Table 3.3 shows that
48,400 new ATMs were set up during this period by
banks across states. One of the factors that limits the us-
ability of rural ATMs for economically weaker sections is
that these machines cannot disburse smaller denomina-
tion notes.
3.8.1 Electronic Payments
It is the central bank’s vision to proactively encourage
electronic payment systems for ushering in a cashless
society and to ensure that the payment systems are safe,
efficient, interoperable, authorized, accessible, inclusive
and compliant with international standards (RBI, 2012).
T
ABLE
3.3
Growth in ATMs: 2012–14
Time period
Number of ATMs operated by
Public sector banks
Private sector banks
Foreign banks
All banks
September 2012
60,573
39,812
1,361
101,746
March 2013
69,652
43,101
1,261
114,014
September 2013
83,146
45,941
1,246
130,333
March 2014
110,424
48,467
1,164
160,055
Source: RBI (2013
–
14).


