agent s of f i nanc i a l i nc lu s i on
73
T
ABLE
3.5
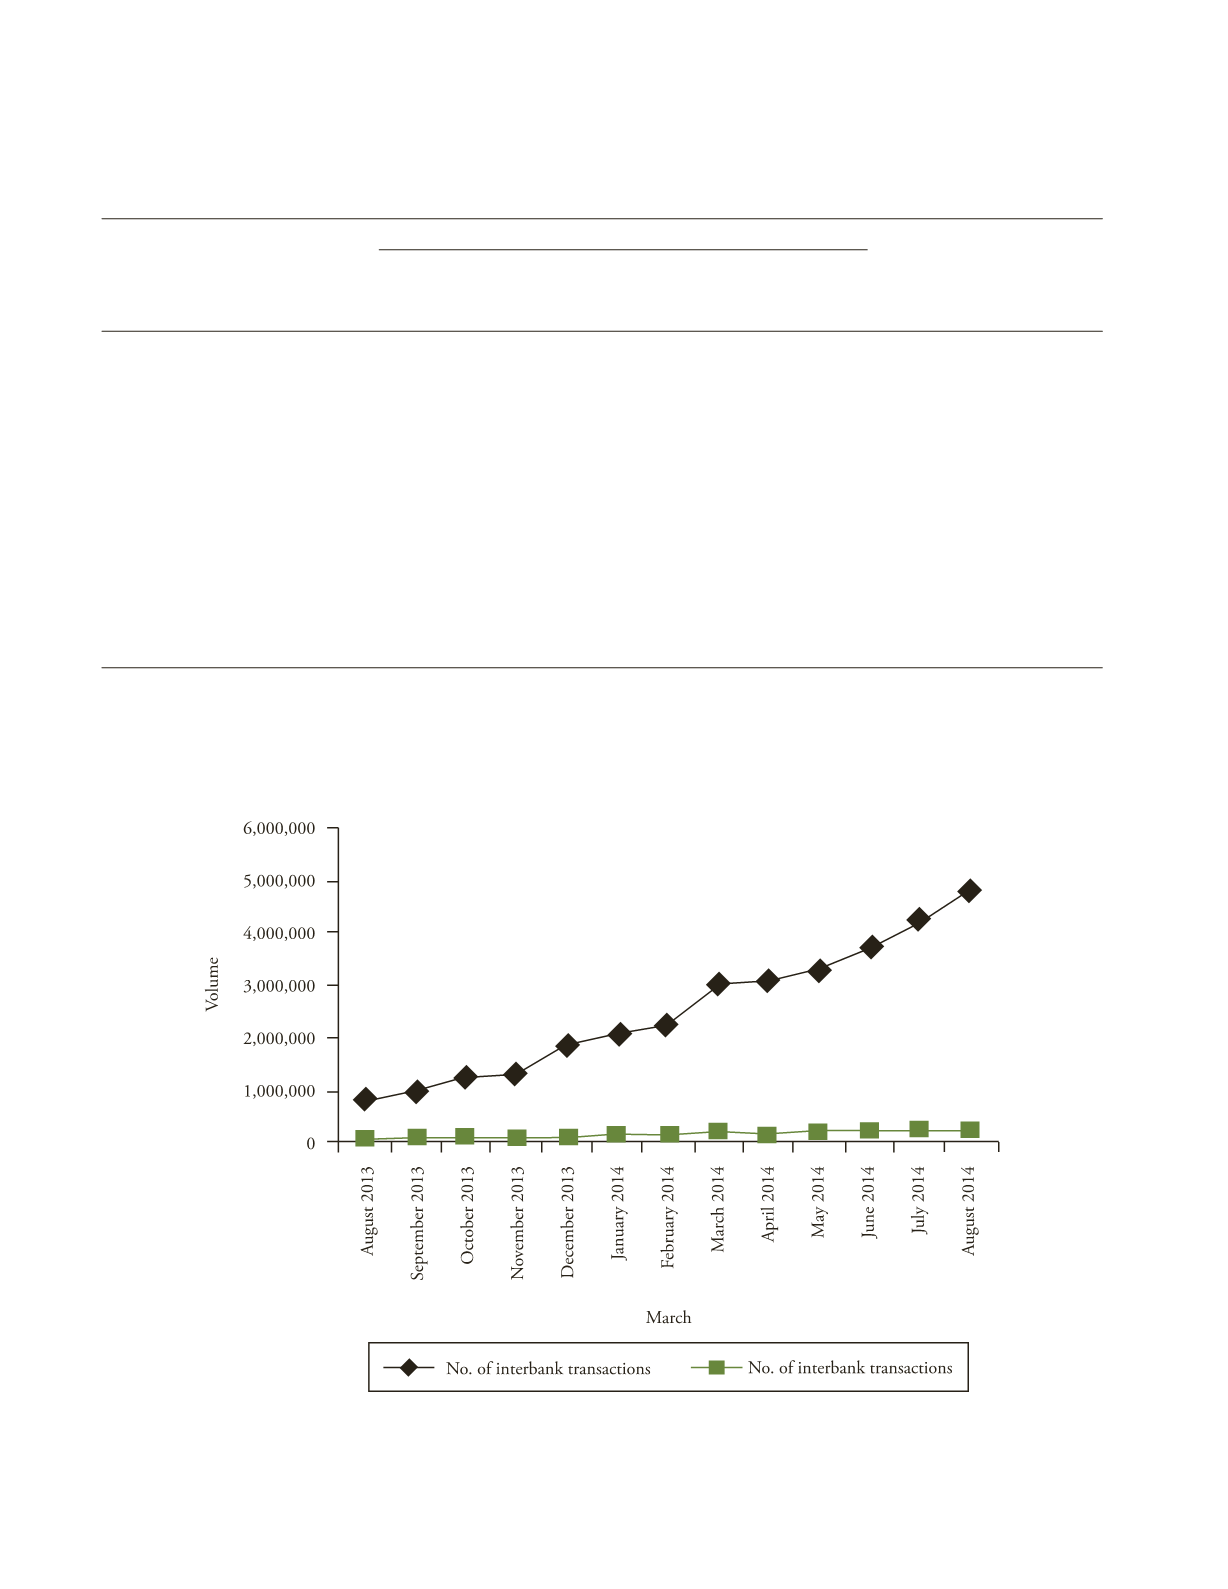
Progress of IMPS Transactions
Month
No. of
No. of
Inter-bank volume
Intra-bank volume
Total no. of
Total
member
MMIDs
No. of
(Rs.
No. of
(Rs.
transactions
(Rs.
banks
issued
transactions
Billion)
transactions
billion)
(million)
billion)
(in million)
(million)
(million)
August 2014
67
63.23
4.80
35.20
0.26
1.58
5.06
36.78
July 2014
65
62.97
4.26
30.19
0.24
1.78
4.50
31.96
June 2014
63
61.90
3.71
26.10
0.20
1.35
3.90
27.45
May 2014
62
60.63
3.30
24.16
0.19
1.21
3.49
25.37
April 2014
60
59.52
3.11
21.57
0.16
1.09
3.28
22.66
March 2014
60
58.49
3.00
20.50
0.17
1.04
3.17
21.54
February 2014
59
58.15
2.23
14.56
0.13
0.76
2.36
15.31
January 2014
59
56.84
2.03
13.20
0.12
0.75
2.15
13.95
December,2013
59
55.76
1.84
11.70
0.11
0.65
1.94
12.35
November 2013
59
54.32
1.31
8.82
0.09
0.53
1.39
9.35
October 2013
59
53.76
1.22
7.32
0.09
0.53
1.31
7.85
September 2013
59
53.15
1.02
5.53
0.09
0.45
1.10
5.98
August 2013
59
52.72
0.79
4.71
0.06
0.36
0.85
5.06
Source
:
(accessed 10 October 2014).
F
IGURE
3.6
Growth in IMPS: 2013–14


