23
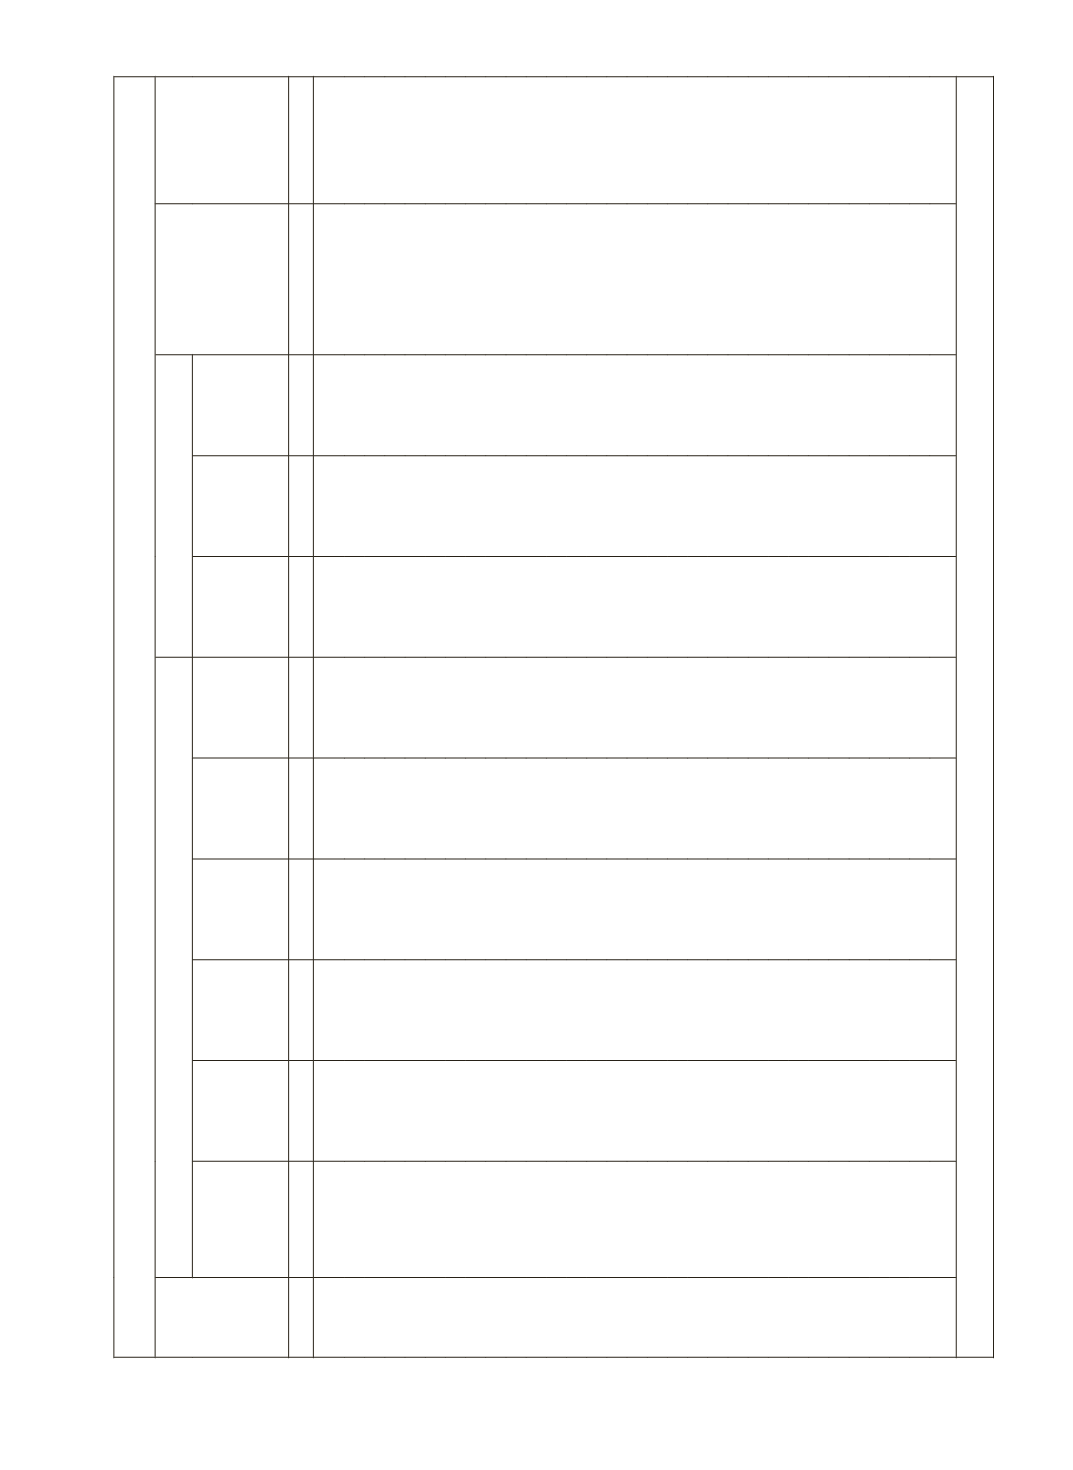
Table 2.9(a): Trends in Gross Capital Formation (GCF) in Agriculture (at Current Prices)
Year
For Agriculture and Allied Activities (Rupees crore)
GCF as % of Agricultural GDP
GCF in
Agriculture as
% of Aggregate
GDP at Current
Market Prices
GCF in
Agriculture as
% of India's
Aggregate
GCF
Total Gross
Capital
Formation
(GCF)
(Per cent)
Public
Sector
(GCF)
(Per cent)
Private
Sector
(GCF)
(Per cent)
Public
Private
Total
(5+6)
(1)
(2)
(3)
(4)
(5)
(6)
(7)
(8)
(9)
(10)
(11)
(12)
1980-81
4228
100
1874
44.3
2355
55.7
3.9
4.9
8.7
2.8
15.7
1981-82
4059
100
2069
51.0
1990
49.0
3.8
3.6
7.4
2.3
10.6
1982-83
4711
100
2223
47.2
2488
52.8
3.8
4.2
8.0
2.4
10.9
1983-84
5574
100
2465
44.2
3110
55.8
3.5
4.4
7.9
2.4
12.2
1984-85
5795
100
2700
46.6
3095
53.4
3.6
4.1
7.7
2.3
10.5
1985-86
6332
100
2802
44.3
3530
55.7
3.5
4.3
7.8
2.2
9.3
1986-87
6971
100
2904
41.7
4066
58.3
3.3
4.7
8.0
2.2
9.2
1987-88
9676
100
3291
34.0
6385
66.0
3.4
6.6
10.0
2.6
11.6
1988-89
9982
100
3410
34.2
6572
65.8
2.8
5.5
8.3
2.3
9.6
1989-90
11140
100
3299
29.6
7840
70.4
2.5
5.9
8.4
2.2
9.3
1990-91
18033
100
3575
19.8
14458
80.2
2.3
9.4
11.7
3.1
12.3
1991-92
14362
100
3597
25.0
10765
75.0
2.0
6.0
8.0
2.1
9.5
1992-93
19657
100
4105
20.9
15553
79.1
2.0
7.7
9.7
2.5
10.5
1993-94
18708
100
4862
26.0
13845
74.0
2.1
5.9
8.0
2.1
9.9
1994-95
19585
100
5940
30.3
13645
69.7
2.2
5.1
7.3
1.9
8.1
1995-96
21578
100
6654
30.8
14924
69.2
2.3
5.1
7.3
1.8
6.8
1996-97
26145
100
7196
27.5
18948
72.5
2.0
5.4
7.4
1.8
8.4
1997-98
30473
100
6759
22.2
23714
77.8
1.8
6.3
8.1
1.9
7.9
1998-99
36046
100
7447
20.7
28598
79.3
1.7
6.6
8.4
2.0
8.5
1999-00
56793
100
8667
15.3
48126
84.7
1.9
10.6
12.5
2.8
10.5
2000-01
52926
100
8175
15.4
44751
84.6
1.8
9.7
11.5
2.4
10.1
2001-02
71696
100
10355
14.4
61341
85.6
2.1
12.3
14.4
3.1
11.9
2002-03
67522
100
9563
14.2
57959
85.8
2.0
11.9
13.9
2.7
10.7
2003-04
66691
100
12218
18.3
54472
81.7
2.2
10.0
12.2
2.3
9.0
2004-05
76096
100
16187
21.3
59909
78.7
2.9
10.6
13.5
2.3
7.2
2005-06
89943
100
20739
23.1
69204
76.9
3.3
10.9
14.1
2.4
7.1
2006-07
101102
100
25606
25.3
75496
74.7
3.5
10.4
14.0
2.4
6.6
2007-08
123317
100
27638
22.4
95679
77.6
3.3
11.4
14.7
2.5
6.5
2008-09
160347
100
26692
16.6 133655
83.4
2.8
14.2
17.0
2.8
8.0
2009-10
181562
100
33237
18.3 148326
81.7
3.1
13.7
16.8
2.8
7.8
2010-11
211565
100
34548
16.3 177017
83.7
2.7
13.9
16.7
2.8
7.7
Source:
CSO: National Accounts Statistics, Various Issues and Recent Press Releases


