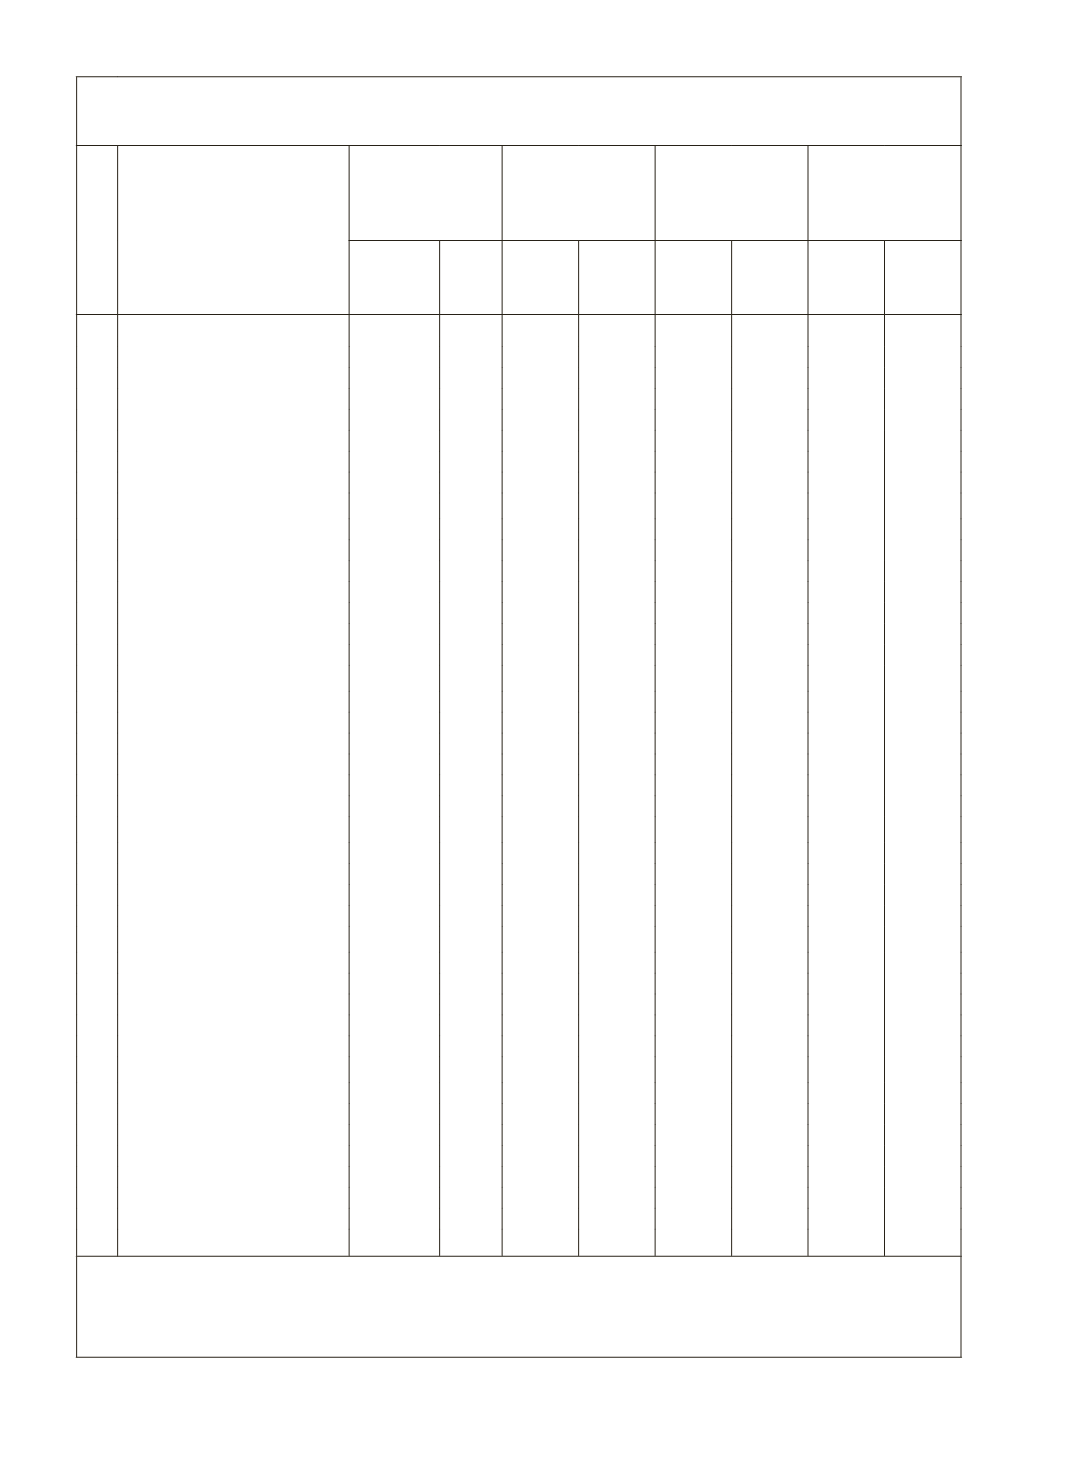
30
Table 2.12: State-wise SDP Growth and Growth of Agriculture SDP
(In percent per annum)
Sl
No.
Region/State/Union
Territory
1980-81 to
1993-94
(at 1980-81
Prices)
1993-94 to
1999-00
(at 1993-94
Prices)
1999-00 to
2004-05
(at 1999-00
Prices)
2004-05 to
2011-12
(at 2004-05
Prices)
Agri-
cultural
GSDP
GSDP Agri-
cultural
GSDP
GSDP Agri-
cultural
GSDP
GSDP Agri-
cultural
GSDP
GSDP
I NORTHERN REGION
1 Haryana
4.48 5.68 2.15 5.96 2.66 8.16 4.15 9.39
2 Himachal Pradesh
2.43 4.71 0.25 7.16 8.03 6.45 1.55 8.29
3 Jammu & Kashmir
-
-
5.24 5.02 3.61 4.21 1.30 5.97
4 Punjab
4.87 5.19 2.49 4.78 1.79 3.95 1.73 7.11
5 Rajasthan
6.18 6.31 5.53 8.34 10.87 5.16 5.86 7.78
6 Chandigarh
-
-
-2.99 9.34 0.94 10.79 -2.10 9.44
7 Delhi
2.82 6.59 -5.32 8.80 0.02 6.63 4.87 11.39
II NORTH-EASTERN REGION
8 Arunachal Pradesh
9.27 9.24 -0.79 3.11 1.64 9.17 5.02 7.87
9 Assam
2.30 3.99 0.24 2.10 -0.12 4.39 4.08 6.05
10 Manipur
2.75 5.08 2.06 5.59 5.75 4.11 5.92 5.84
11 Meghalaya
1.09 5.19 7.20 6.94 4.75 6.01 2.43 7.99
12 Mizoram
-
-
0.10 5.84 5.67 7.96
13 Nagaland
7.89 7.77 8.43 4.38 14.15 9.42 4.01 6.98
14 Tripura
2.50 5.80 3.72 7.65 3.96 8.08 5.73 8.21
III EASTERN REGION
15 Bihar
1.28 3.40 3.06 4.70 7.42 6.03 5.36 10.17
16 Jharkhand
-
-
4.34 5.34 5.03 4.54 6.32 6.53
17 Orissa
2.36 3.90 -0.02 4.42 3.54 6.46 3.15 8.52
18 Sikkim
9.22 10.63 -1.16 5.83 6.54 7.69 3.42 18.53
19 West Bengal
5.10 4.78 4.10 7.11 2.42 5.61 2.56 6.94
20 Andaman & Nicobar Islands
-
-
-
-
-
-
-
-
IV CENTRAL REGION
21 Chhattisgarh
-
-
-2.12 2.88 4.55 6.00 7.27 9.15
22 Madhya Pradesh
3.75 4.91 2.69 6.27 2.22 2.16 6.42 8.77
23 Uttar Pradesh
2.69 4.34 3.47 4.73 1.04 3.75 3.01 7.04
24 Uttarakhand
-
-
2.38 3.22 3.26 9.62 2.31 13.75
V WESTERN REGION
25 Goa
2.43 5.73 1.25 9.22 0.40 5.11 1.83 8.95
26 Gujarat
7.46 6.11 5.19 8.01 9.08 7.06 5.55 8.81
27 Maharashtra
5.23 6.67 3.09 6.30 1.58 5.09 4.69 9.97
28 Dadra & Nagar Haveli
-
-
-
-
-
-
-
-
29 Daman & Diu
-
-
-
-
-
-
-
-
VI SOUTHERN REGION
30 Andhra Pradesh
3.80 6.11 2.81 5.53 4.69 6.52 4.96 8.90
31 Karnataka
4.23 5.71 4.10 7.66 -2.94 4.42 5.12 8.37
32 Kerala
2.63 4.25 1.88 5.66 1.69 6.44 -0.22 8.31
33 Tamil Nadu
5.72 5.71 1.80 6.67 -0.50 4.70 5.37 9.68
34 Lakshdweep
-
-
-
-
-
-
-
-
35 Puducherry
0.56 3.29 0.83 13.92 -1.97 4.90 9.15 10.49
India *
3.30 5.20 2.64 6.10 2.09 5.24 3.09 7.54
CV for States
58.07 29.36 130.38 37.44 108.83 31.96 56.17 27.61
Notes:
* Aggregate GSDP derived as summation of All State's GSDP.
For Nagaland & Sikkim, 1980-81 Price Series are available up to the year 1991-92.
For Gujarat & Mizoram, 2004-05 Price Series are available up to the year 2010-11.
Source:
EPWRF's ONLINE Data Base on State Domestic Product (
.


