27
been a sharp reduction from 2.64% per annum during 1993-94 to 1999-
2000 and 3.30% per annum during 1980-81 to 1993-94. As shown in Table
2.12, almost every state experienced reduced agriculture GSDP growth after
the 1990s as compared with the growth in the 1980s. However, the all-India
picture presented above does hide serious inter-state differences in agricultural
incomes growth. First, in the latest crisis period (1999-2000 to 2004-05), two
of the four major southern states, namely, Tamil Nadu and Karnataka as well
as Puducherry and Assam have experienced absolute reductions in GSDP
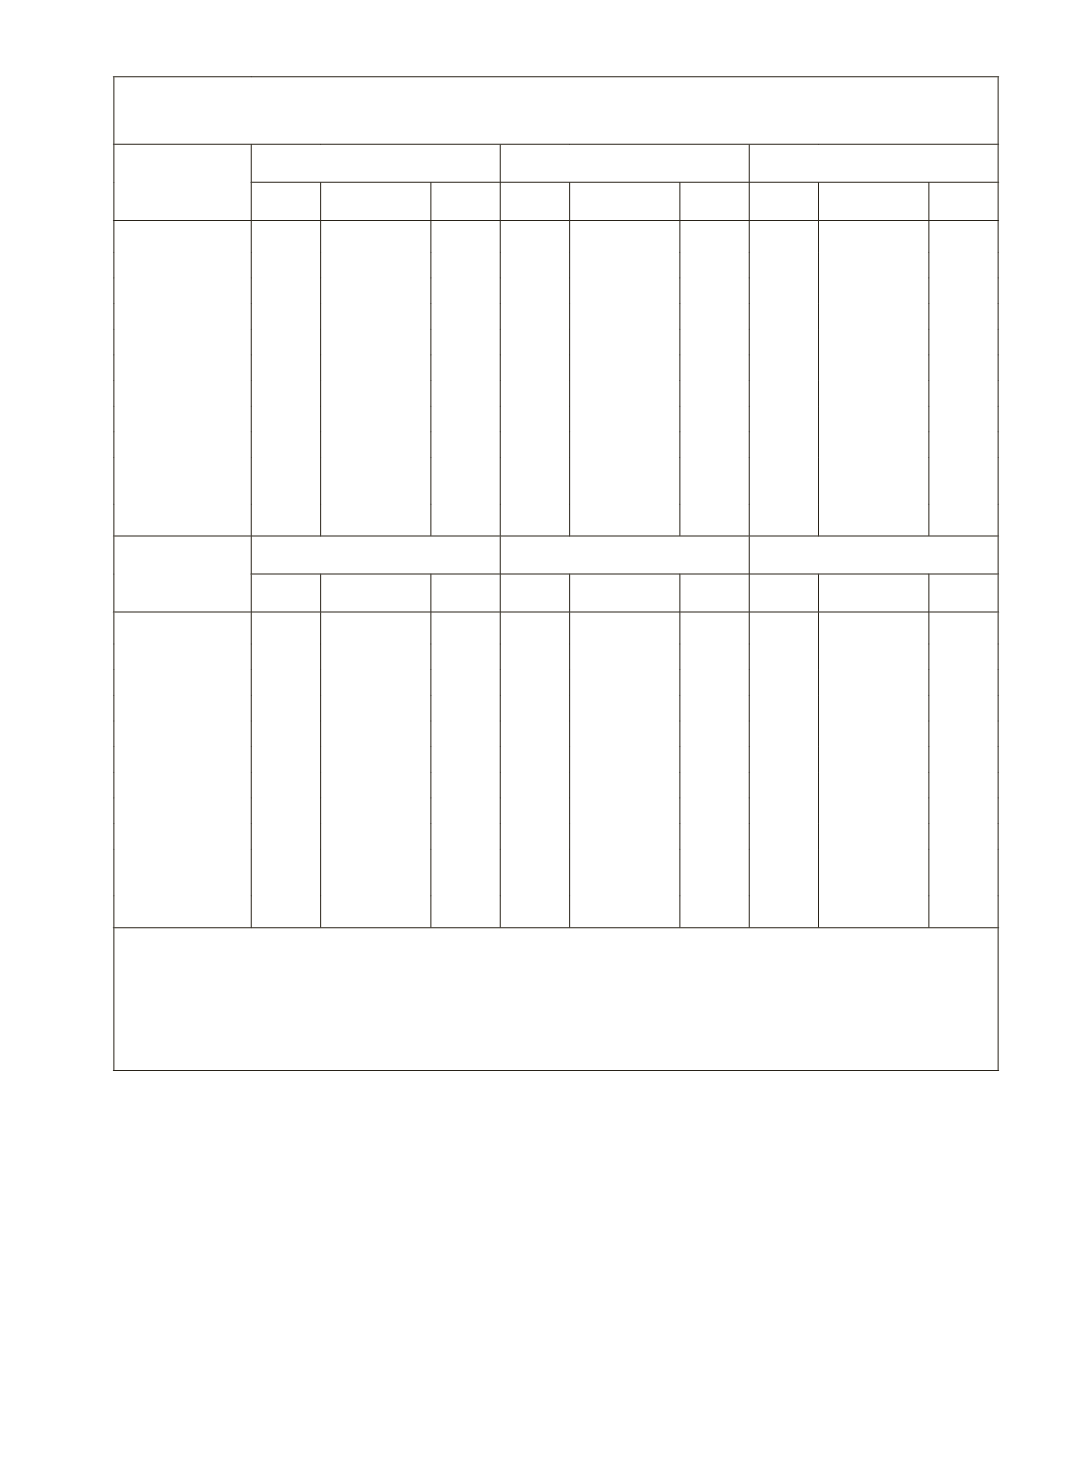
Table 2.10: Growth of Area, Production and Yield of Major Crops in India
(Averages of Annual Growth in Percentages)
Crops
1950-51 to 1966-67
1966-67 to 1979-80
1979-80 to 1990-91
Area Production Yield Area Production Yield Area Production Yield
Rice
0.87
3.13 2.14 0.9
3.56 2.37 0.81
6.05 4.93
Wheat
1.93
4.37 2.35 4.46
9.13 4.15 0.84
5.43 4.48
Coarse Cereals 1.18
3.29 1.9 -0.57
1.74 2.04 -1.09
2.43 3.43
Total Cereals
1.07
3.2 1.94 60.15
3.98 2.92 0.07
4.76 4.55
Total Pulses
1.01
1.03 -0.17 0.23
1.8 1.24 1.08
5.44 4.13
Foodgrains
1.11
2.13
1 0.69
3.6 2.15 0.26
5.04 4.32
Sugarcane
2.56
4.42 1.62 1.49
3.3 1.81 3.44
6.19 2.72
Oilseeds
2.23
2.09 -0.11 1.1
4 2.4 3.37
8.56 4.64
Cotton (lint)
1.96
4.88 2.73 0.39
4.22 3.61 -0.64
4.14 4.35
Non-
Foodgrains
1.97
2.64 0.41 0.62
2.69 1.65 2.06
5.3 2.98
All Crops
1.28
2.26 0.79 0.67
3.18 1.92 0.69
5.07 3.76
Crops
1990-91 to 1999-00
1999-00 to 2004-05
2004-05 to 2011-12
Area Production Yield Area Production Yield Area Production Yield
Rice
0.64
2.21 1.54 -1.41
-0.26 0.72 0.39
3.50 1.79
Wheat
1.48
3.84 2.34 -0.73
-1.82 -1.23 1.42
4.63 2.03
Coarse Cereals -2.28
0.56 2.52 0.10
4.24 3.14 -0.28
4.27 5.05
Total Cereals
-0.11
2.27 2.34 -0.83
-0.28 0.16 0.45
3.93 2.55
Total Pulses
-1.6
-0.04 1.43 1.82
1.70 -1.10 2.31
4.30 2.69
Foodgrains
-0.39
2.02 2.11 -0.36
-0.15 -0.25 0.59
4.01 3.37
Sugarcane
1.69
2.7 0.99 -2.60
-4.25 -1.65 4.91
7.00 1.22
Oilseeds
0.17
1.71 1.53 2.91
7.85 4.10 -0.09
4.30 5.19
Cotton (lint)
1.95
2.57 0.6 0.74
10.55 9.87 3.64
12.46 7.33
Non-
Foodgrains
1.3
2.65 1.51 1.05
-2.56 -3.08 2.13
7.07 4.80
All Crops
0.08
2.25 1.91 0.00
-1.15 -1.26 1.16
5.92 4.63
Notes:
Growth is measured as average of annual growth rates in percentages
Rice to Cotton (lint): Area & Yield figures are available only up to 2010-11
Source:
(i) Growth of items Rice to Cotton (lint) are based on physical output figures from the Union
Ministry of Agriculture compiled and placed on website under the EPWRF's online data base (www.
epwrfits.in) (ii) Growth of foodgrains, non-foodgrains and all crops are based index numbers available in
RBI's Handbook of Statistics on the Indian Economy 2011-12.


