25
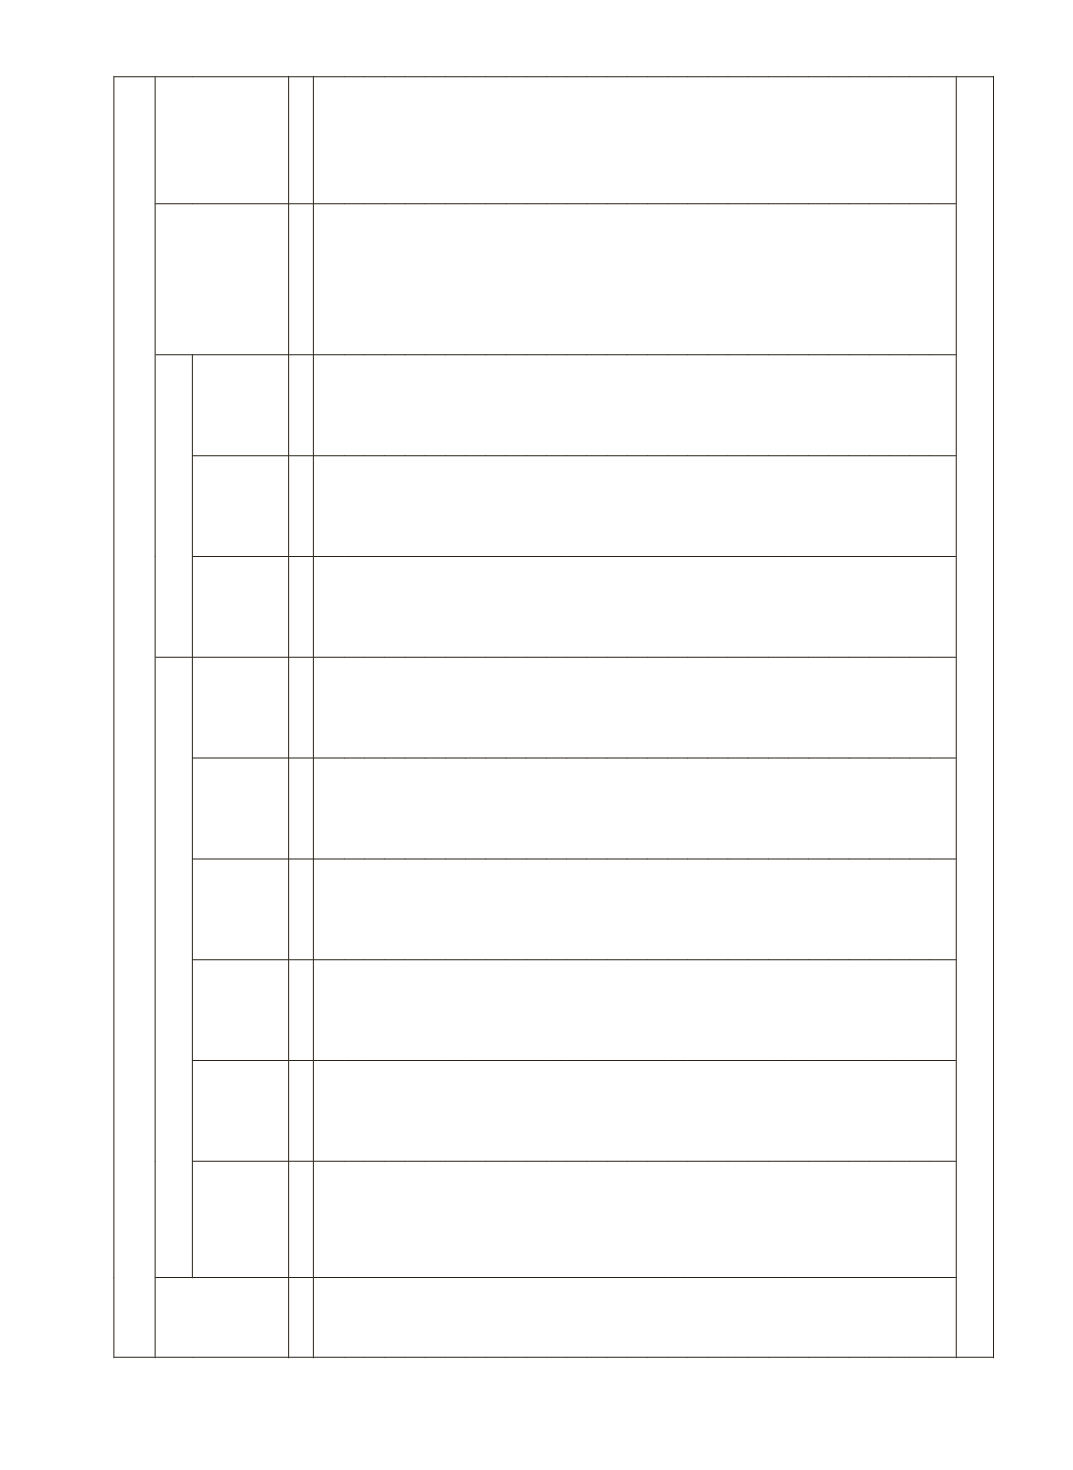
Table 2.9(b): Trends in Gross Capital Formation(GCF) in Agriculture (at Constant 2004-05 Prices)
Year
For Agriculture and Allied Activities (Rupees crore)
GCF as % of Agricultural GDP
GCF in
Agriculture as
% of Aggregate
GDP at Current
Market Prices
GCF in
Agriculture as
% of India's
Aggregate
GCF
Total Gross
Capital
Formation
(GCF)
(Per cent)
Public
Sector
(GCF)
(Per cent)
Private
Sector
(GCF)
(Per cent)
Public
Private
Total
(5+6)
(1)
(2)
(3)
(4)
(5)
(6)
(7)
(8)
(9)
(10)
(11)
(12)
1980-81
32998
100
16240
49.2
16757
50.8
5.7
5.9
11.6
3.8
18.4
1981-82
27840
100
15234
54.7
12606
45.3
5.1
4.2
9.3
3.0
13.3
1982-83
29139
100
14910
51.2
14229
48.8
5.0
4.8
9.8
3.1
13.6
1983-84
32110
100
15434
48.1
16676
51.9
4.7
5.1
9.8
3.1
14.8
1984-85
29863
100
14786
49.5
15078
50.5
4.4
4.5
9.0
2.8
12.7
1985-86
28396
100
13220
46.6
15176
53.4
4.0
4.5
8.5
2.5
11.1
1986-87
30101
100
13175
43.8
16925
56.2
4.0
5.1
9.1
2.6
11.1
1987-88
36632
100
13114
35.8
23518
64.2
4.0
7.2
11.2
3.0
13.5
1988-89
33857
100
12107
35.8
21750
64.2
3.2
5.8
9.0
2.5
11.0
1989-90
34160
100
10601
31.0
23559
69.0
2.8
6.2
8.9
2.4
10.6
1990-91
51114
100
10546
20.6
40568
79.4
2.6
10.2
12.8
3.4
14.1
1991-92
35578
100
9239
26.0
26339
74.0
2.4
6.8
9.1
2.4
10.9
1992-93
45760
100
10048
22.0
35712
78.0
2.4
8.6
11.0
2.9
12.2
1993-94
39261
100
10593
27.0
28668
73.0
2.5
6.7
9.1
2.4
11.2
1994-95
36503
100
11389
31.2
25114
68.8
2.5
5.6
8.1
2.1
8.9
1995-96
36034
100
11349
31.5
24685
68.5
2.5
5.5
8.1
1.9
7.4
1996-97
38980
100
10872
27.9
28109
72.1
2.2
5.7
7.9
1.9
8.8
1997-98
41376
100
9162
22.1
32214
77.9
1.9
6.7
8.6
1.9
7.9
1998-99
46890
100
9716
20.7
37174
79.3
1.9
7.3
9.2
2.1
8.5
1999-00
68589
100
10283
15.0
58307
85.0
2.0
11.2
13.1
2.8
10.2
2000-01
62109
100
9457
15.2
52652
84.8
1.8
10.1
11.9
2.4
9.9
2001-02
80718
100
11601
14.4
69117
85.6
2.1
12.5
14.6
3.0
11.6
2002-03
73514
100
10299
14.0
63215
86.0
2.0
12.2
14.2
2.6
10.3
2003-04
69921
100
12683
18.1
57238
81.9
2.2
10.1
12.4
2.3
8.8
2004-05
76096
100
16187
21.3
59909
78.7
2.9
10.6
13.5
2.3
7.2
2005-06
86604
100
19940
23.0
66664
77.0
3.4
11.2
14.6
2.4
7.1
2006-07
92057
100
22987
25.0
69070
75.0
3.7
11.2
14.9
2.4
6.5
2007-08
105741
100
23257
22.0
82484
78.0
3.6
12.6
16.1
2.5
6.4
2008-09
127127
100
20572
16.2 106555
83.8
3.1
16.3
19.4
2.9
7.8
2009-10
131139
100
22719
17.3 108420
82.7
3.4
16.4
19.8
2.7
7.2
2010-11
142254
100
21500
15.1 120754
84.9
3.0
17.0
20.1
2.7
7.1
Source:
CSO: National Accounts Statistics, Various Issues and Recent Press Releases


