67
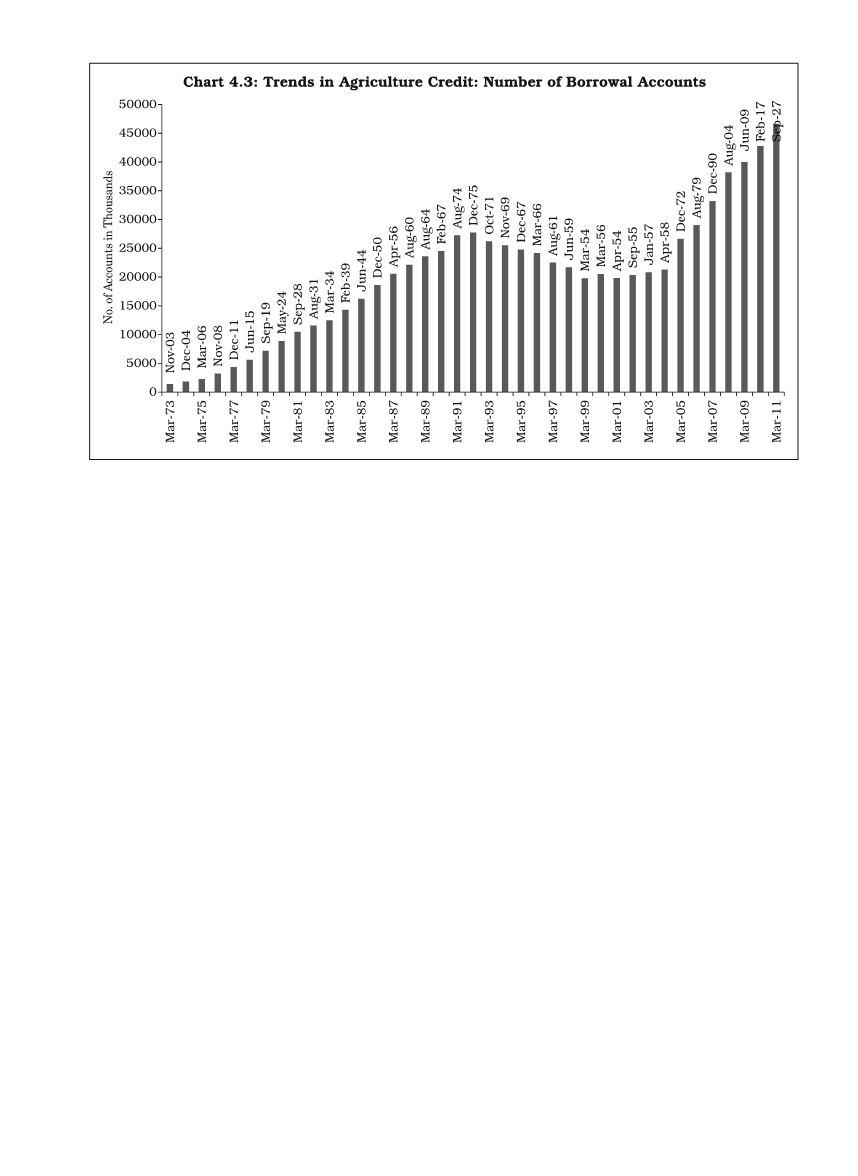
edging up in both the indicators in the latest phase of the policy of doubling
of farm credit flows in three years between the year-ending March 2004 to
March 2011; the latest phase have not been one of continuous rise. After some
steep increase following the policy announcement of credit doubling in there
years, which continued for about six years until 2006-07, there was a relative
slowdown. Of course, this slowdown was better reflected in the data presented
earlier of annual growth rates of bank credit against agriculture, particularly
in
real
terms. On the other hand, the shares of agricultural accounts and
amounts outstanding in total bank loan accounts and amounts did not reflect
this slowdown (Tables 4.5 and 4.7).
There are two additional distinctive features in data presented in Tables
4.5 and 4.6. First, the average loan per account jumped up after the 1990s
implying that the loan sizes have risen rather significantly – a feature which has
been analysed in-depth in the context of the size distribution of agricultural
loans. As shown in Table 4.5, between 1972 and 1994, the average loan per
account ranged from
`
3,651 to
`
8,957 but thereafter, with banks’ focus on
large-size loans, the average loan size has shot up to a range of
`
10,054 to
`
98,849 per loan account. While both direct and indirect lendings have shown
such large average loans, the indirect loans have shot up rather phenomenally.
Secondly, Tables 4.6 and Chart 4.4 present details of direct and indirect
finance in agriculture. As indicated above, indirect finance has a commercial
angle though ultimately intended to serve agriculture. When the phase of


