70
in total agricultural credit outstandings have been presented. Instead, annual
variations presented in Table 4.6 bring out a more telling effect of the shifting
importance of the two types of agricultural loans. Initially, when the banks
generally reduced their lendings to the agricultural sector in the mid-1990s,
they chose to rely more on indirect lendings. This trend continued particularly
after the policy of doubling bank credit began in 2004. Overall, between March
2000 and March 2007, there had occurred a seven-fold expansion in indirect
credit outstandings (i.e., 729% increases) as against an experience of just
three-fold expansion in direct credit (i.e., 345%) during the same period. As
percentage of total agricultural credit, the share of indirect advances rose from
15.5% to 25.5% during the above period (earlier Table 4.6). As for the number
of loan accounts, the increase in some years under indirect finance has been
very sizeable but overall very erratic. During the last three years, the increases
have ranged from (-) 6.1% in 2007-08 to 144.2% in 2009-10. As shown in
Table 4.8, the increases in the number of accounts for certain types of
institutional accounts had been mindboggling, but they were very erratic too,
giving rise to doubts on the credibility of data. Incidentally, even for the earlier
period, the number of loan accounts and amounts outstanding have exhibited
erratic tendencies (Table 4.6). In the years since 2007, the increases in indirect
lendings have been somewhat moderate. Under the policy of financial inclusion,
there have been social pressure on the banking system to expand direct lendings
to farmers. Such direct lendings have increased by 120% between March 2007
and 2011, whereas indirect lendings have just increased by 41% during the
same period. As cited earlier, the movements in the number of accounts under
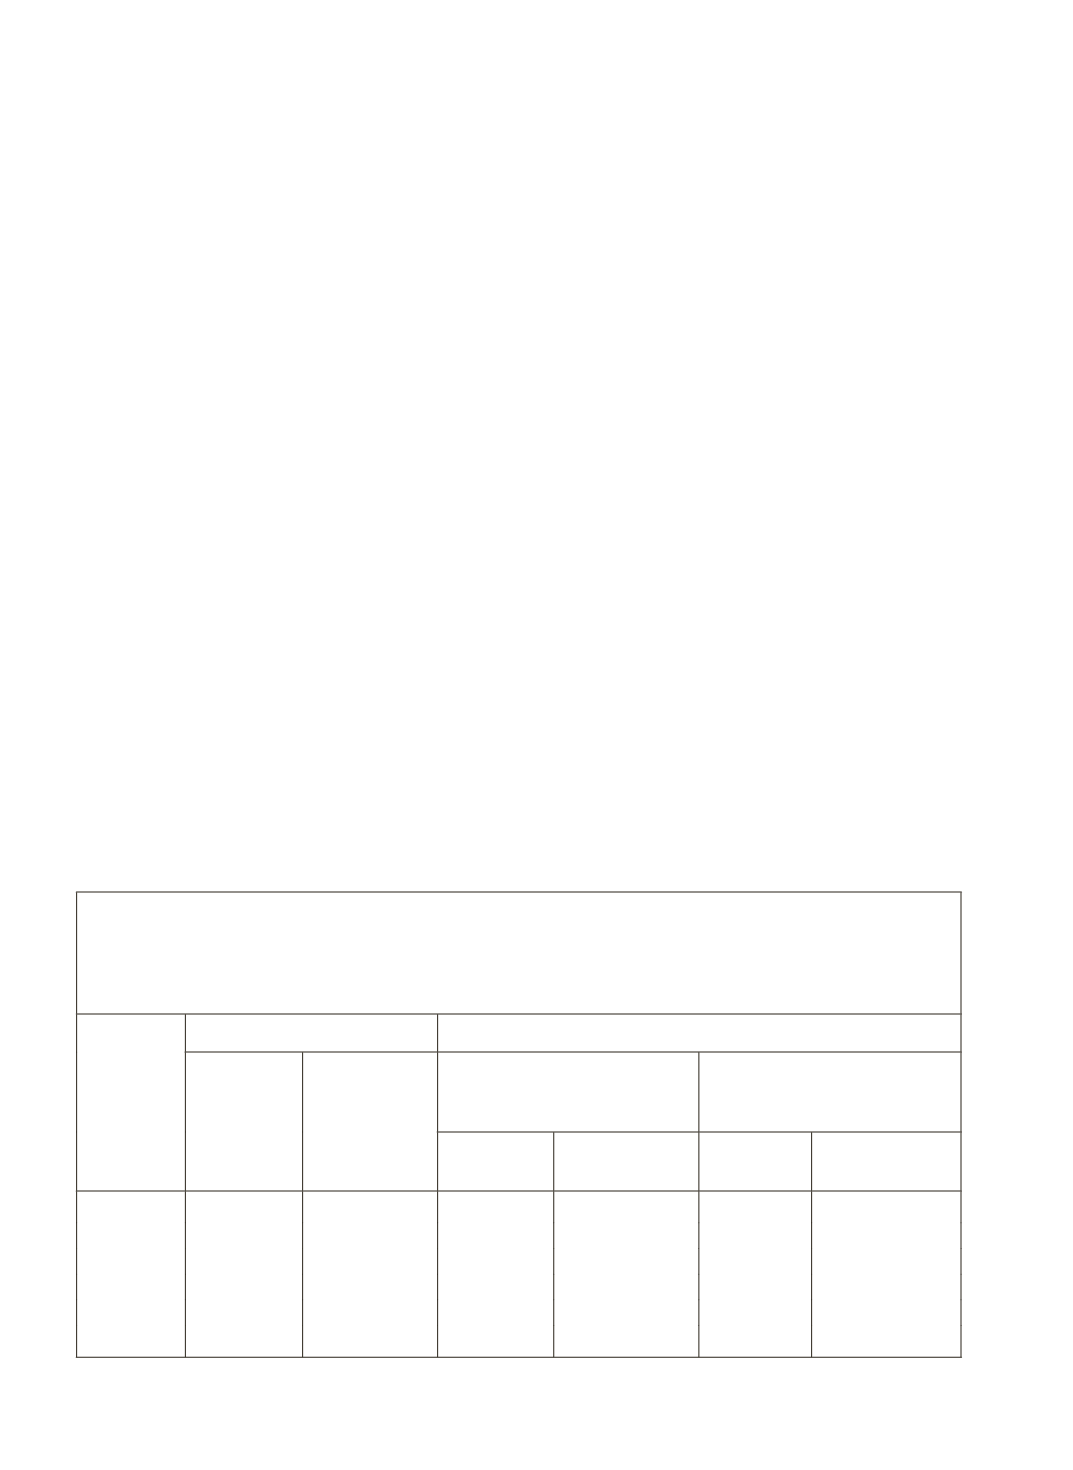
Table 4.8: Sub-Categories of Direct and Indirect Advances: Amount
Outstanding and Number of Loan Accounts
Part A: Earlier Classification
(Amount in Rupees, Crore)
Year
Ending
Mach
Direct Advances
Indirect Advances
Number of
Accounts
Amount
Outstanding
Finance for Distribution of
fertilizers and Other Inputs
Other Types of Indirect
Finance (including state
electricity boards and RIDF)
Number of
Accounts
Amount
Outstanding
Number of
Accounts
Amount
Outstanding
2001
19,035,374 40,485
80,219
2,304
202,166
16,521
2002
15,854,277 46,580
75,002
3,304
423,183
14,935
2003
17,003,304 56,858
101,289
3,241
155,855
19,501
2004
19,634,319 70,781
86,606
4,118
94,540
23,679
2005
20,932,515 95,562
80,894
5,134
628,796
30,079
2006
NA
1,34,798
NA
6,440
NA
49,965


