72
Of the total increase of
`
184,553 crore in agricultural credit between
March 2000 and March 2007, about 41.3% or
`
76,182 crore had been from
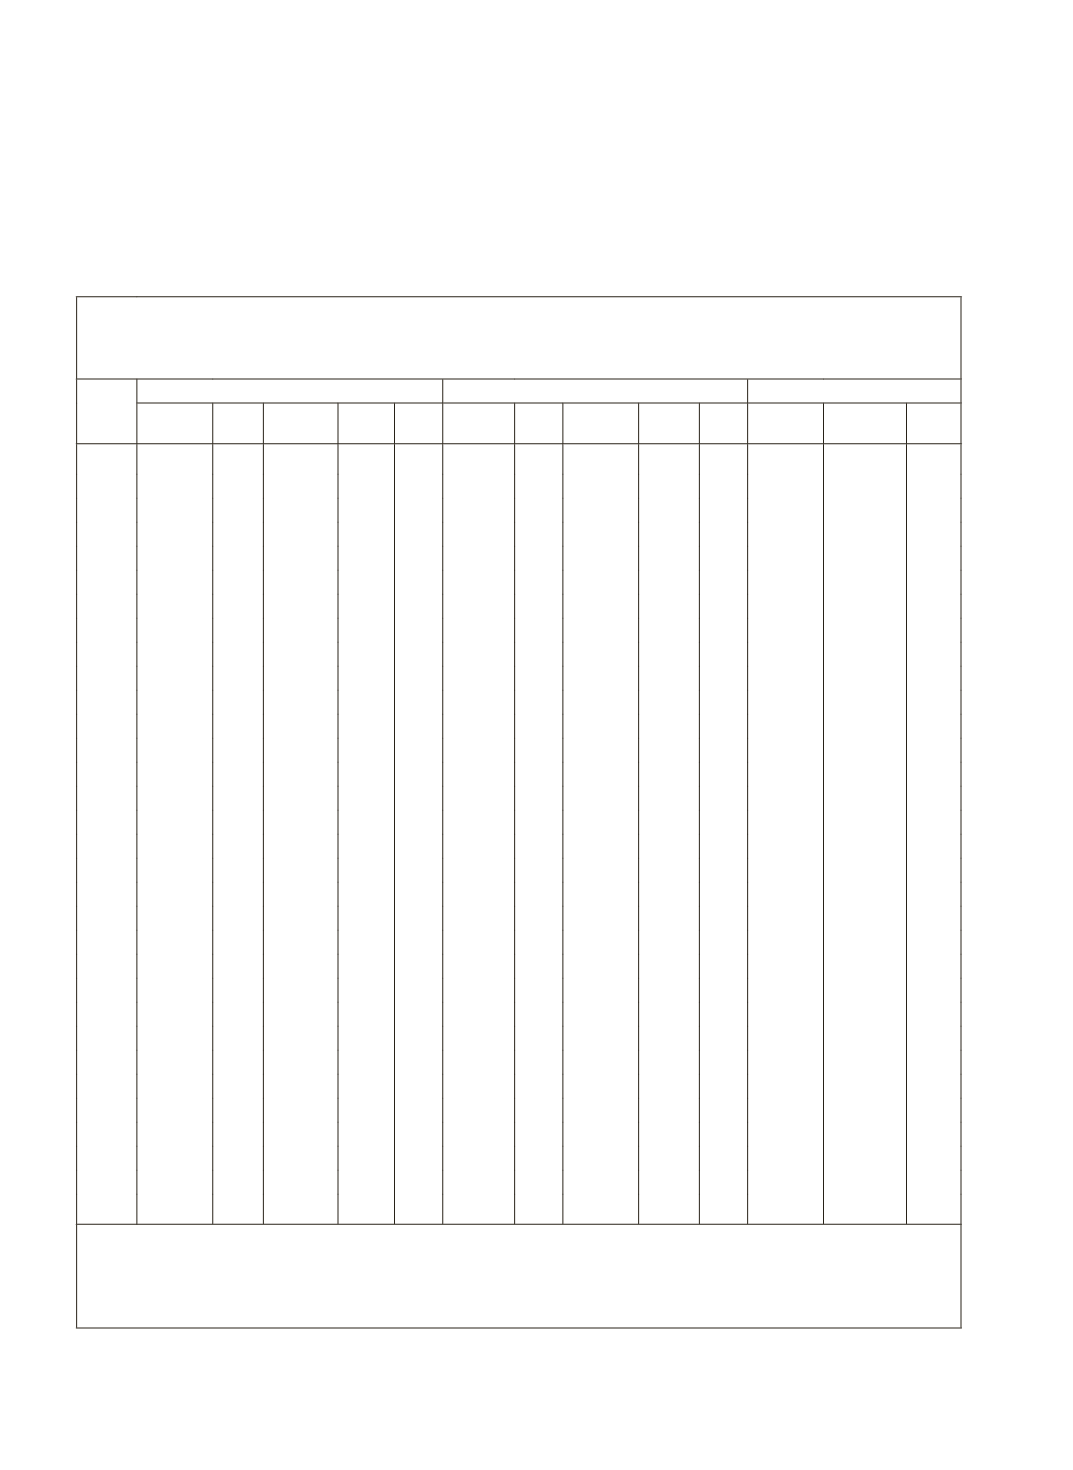
urban and metropolitan branches of banks, while rural and semi-urban
branches accounted for 58.7% of incremental farm credit during the same
period (Table 4.9). Between March 2003 and March 2007, the heyday of the
process of doubling, the incremental agricultural credit had formed about 42%
Table 4.9: Population Group-wise Agriculture Credit of
Scheduled Commercial Banks in India
(Amount in Rupees Lakh)
Year
Rural+Semi-Urban
Urban+Metropolitan
Total
No. of
Accounts
% to
Total
Amount y-o-y
growth
% to
Total
No. of
Accounts
% to
Total
Amount
y-o-y
growth
% to
Total
No. of
Accounts
Agriculture y-o-y
growth
Jun-80 8157363 90.6 221122
70.2 851306 9.4 94082
29.8 9008669 315204
Jun-81 9495248 89.5 287730 30.1 69.2 1116449 10.5 128292 36.4 30.8 10611697 416022 32.0
Jun-82 10877442 91.5 364218 26.6 71.8 1004836 8.5 143376 11.8 28.2 11882278 507594 22.0
Jun-83 11474361 89.2 403303 10.7 69.7 1395761 10.8 175296 22.3 30.3 12870122 578599 14.0
Jun-84 13270297 90.8 567382 40.7 74.1 1345241 9.2 198095 13.0 25.9 14615538 765477 32.3
Jun-85 15122289 90.9 683213 20.4 77.5 1505955 9.1 198811 0.4 22.5 16628244 882024 15.2
Jun-86 17306931 91.2 761234 11.4 77.9 1670303 8.8 215795 8.5 22.1 18977234 977029 10.8
Jun-87 18994650 91.3 857375 12.6 77.8 1799791 8.7 244498 13.3 22.2 20794441 1101873 12.8
Jun-88 20554993 91.8 991532 15.6 79.2 1831617 8.2 260128 6.4 20.8 22386610 1251660 13.6
Jun-89 21770675 92.4 1209812 22.0 79.2 1801217 7.6 316769 21.8 20.8 23571892 1526581 22.0
Mar-90 22738331 92.7 1414963 17.0 85.1 1782264 7.3 247645 -21.8 14.9 24520595 1662608 8.9
Mar-91 25323737 92.9 1560621 10.3 84.0 1933356 7.1 296719 19.8 16.0 27257093 1857340 11.7
Mar-92 25946430 93.5 1721868 10.3 85.1 1790288 6.5 301896 1.7 14.9 27736718 2023764 9.0
Mar-93 24687413 94.2 1852577 7.6 84.0 1529374 5.8 353444 17.1 16.0 26216787 2206021 9.0
Mar-94 24177377 94.7 1908658 3.0 83.4 1357755 5.3 378630 7.1 16.6 25535132 2287288 3.7
Mar-95 23302918 93.9 2088243 9.4 83.7 1511081 6.1 406559 7.4 16.3 24813999 2494802 9.1
Mar-96 22723665 93.9 2334249 11.8 81.0 1464908 6.1 546646 34.5 19.0 24188573 2880895 15.5
Mar-97 21188389 94.1 2519416 7.9 79.6 1335975 5.9 643999 17.8 20.4 22524364 3163415 9.8
Mar-98 20513822 94.4 2825698 12.2 80.1 1206233 5.6 700554 8.8 19.9 21720055 3526252 11.5
Mar-99 18782640 94.9 3182862 12.6 77.8 1005745 5.1 906063 29.3 22.2 19788385 4088925 16.0
Mar-00 19475312 94.8 3610965 13.5 79.1 1057579 5.2 952862 5.2 20.9 20532891 4563827 11.6
Mar-01 18643228 94.0 4013929 11.2 77.6 1200061 6.0 1159106 21.6 22.4 19843289 5173035 13.3
Mar-02 19343338 95.0 4649651 15.8 72.6 1007846 5.0 1751204 51.1 27.4 20351184 6400855 23.7
Mar-03 19837120 95.2 5522910 18.8 72.7 1003314 4.8 2070612 18.2 27.3 20840434 7593522 18.6
Mar-04 20173953 94.7 6362353 15.2 66.1 1130215 5.3 3262150 57.5 33.9 21304168 9624503 26.7
Mar-05 25209573 94.6 8622419 35.5 69.3 1446735 5.4 3816069 17.0 30.7 26656308 12438488 29.2
Mar-06 26891025 92.5 10778710 25.0 62.4 2177088 7.5 6489697 70.1 37.6 29068113 17268407 38.8
Mar-07 30677507 92.4 14448085 34.0 62.8 2539060 7.6 8571023 32.1 37.2 33216567 23019108 33.3
Mar-08 34736944 90.9 18079774 25.1 66.0 3468234 9.1 9334338 8.9 34.0 38205178 27414112 19.1
Mar-09 34379875 86.0 20596377 13.9 66.6 5600619 14.0 10350566 10.9 33.4 39980494 30946943 12.9
Mar-10 38885483 90.9 25884609 25.7 66.3 3884346 9.1 13145221 27.0 33.7 42769829 39029830 26.1
Mar-11 42108392 90.3 30830021 19.1 66.9 4530709 9.7 15272167 16.2 33.1 46639101 46102188 18.1
From June 1980 to June 1983 classification is based on 1971 Census. From June 1984 to March 1994 classification is based on 1981
Census.
From March 1995 to March 2005 classification of centres is based on 1991 Census data. From March 2006 classification is based on
2001 Census.
Source:
As in Table 4.5.


