2
S
tate
of
I
ndia
’
s
L
ivelihoods
R
eport
2015
Finally, the forecast of near normal monsoon
is expected to boost agricultural GDP and the
overall growth impetus.
Savings rate in the economy (Table 1.1) as
a whole have been declining over the last few
years, reflecting a declining capacity to invest
in future. The gross capital formation rates
have been seen to decline during the period,
indicating that investments required to secure
future livelihood development are not taking
place at the expected pace. RBI noted
4
that
the investment rate (gross capital formation as
a proportion toGDP at current market prices)
declined in 2012–13 and 2013–14, largely
reflecting the slackening in the non-financial
corporations’ investment rate on account
of weak domestic and external demand and
other structural factors such as delay in land
acquisition and environment clearances, weak
business confidence and policy uncertainties.
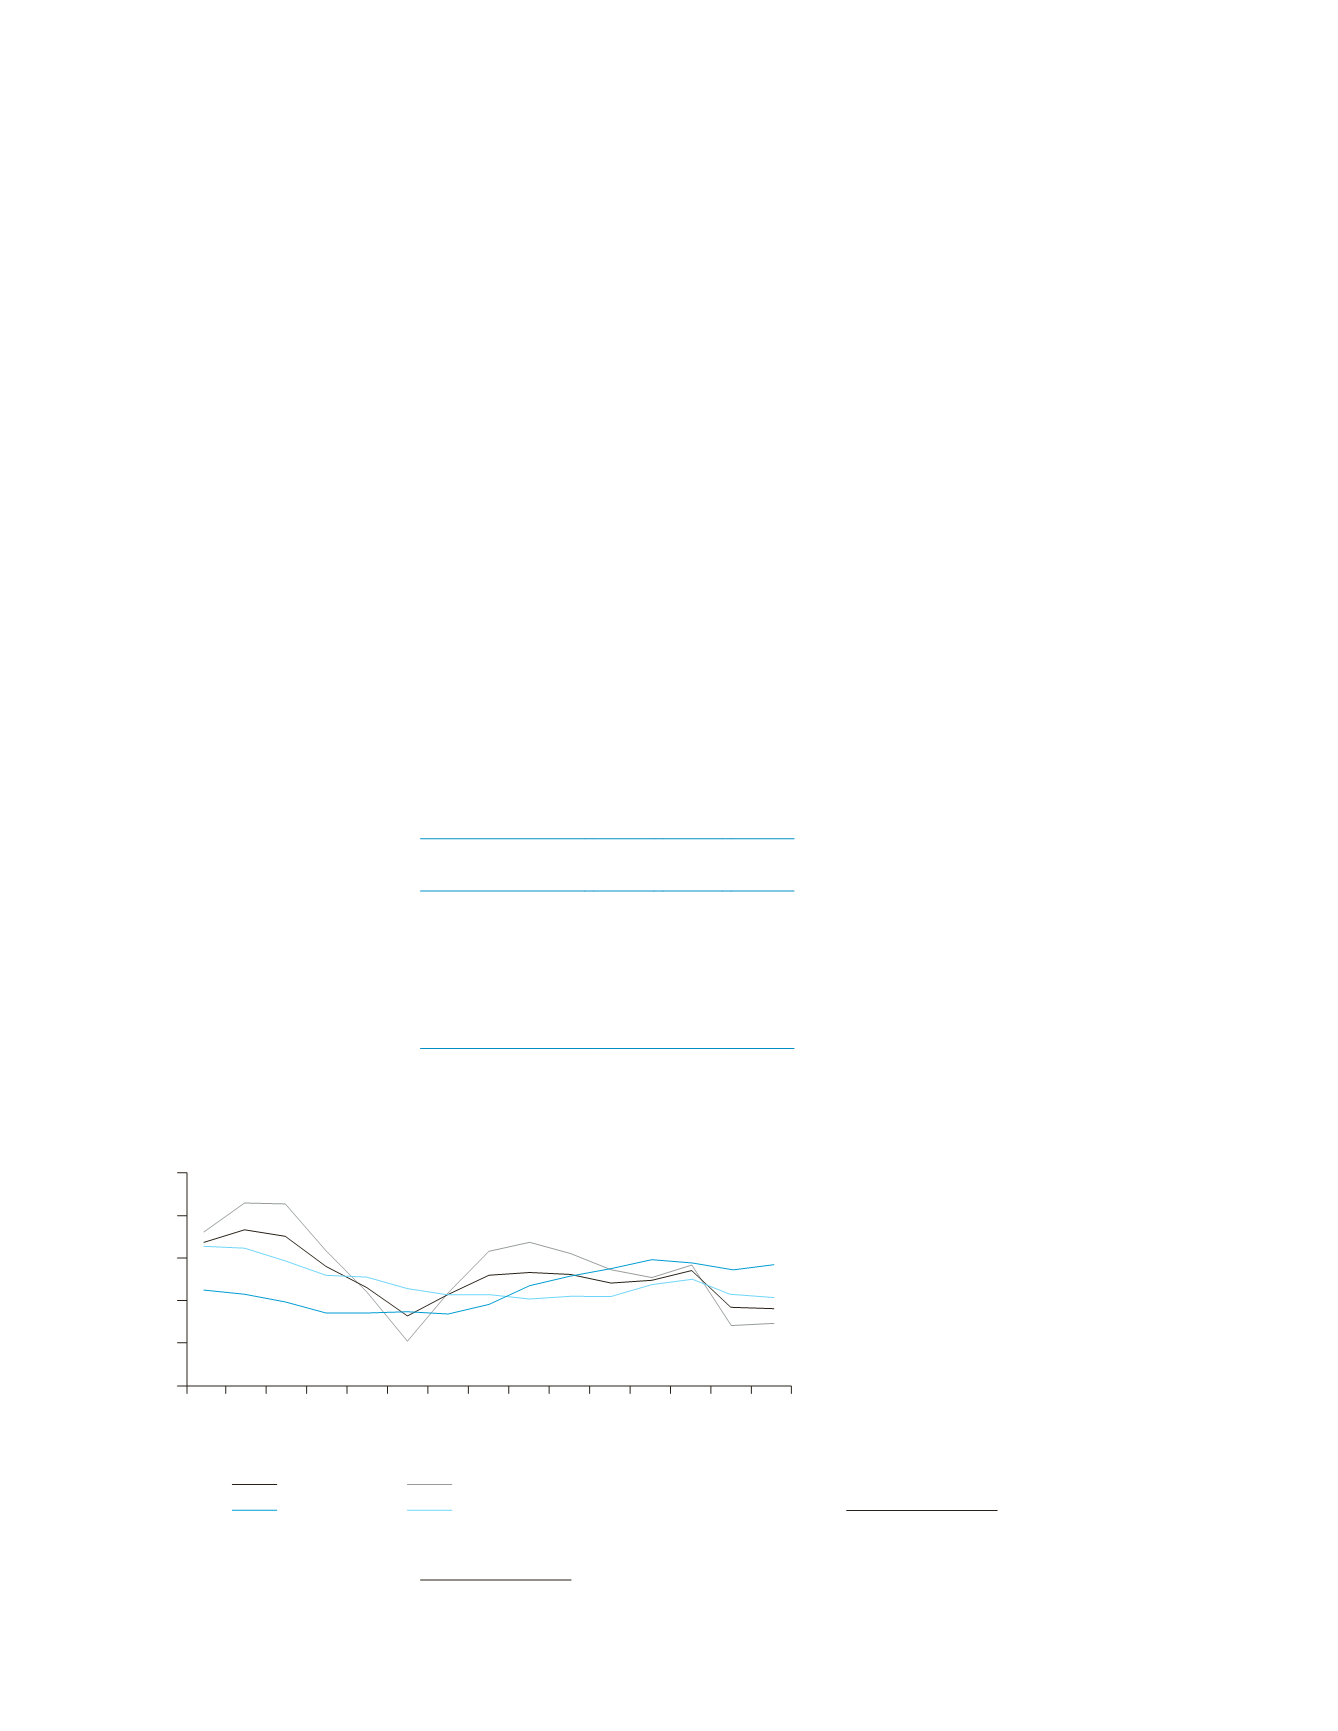
On the price front, inflation seems to be
declining steadily since the past couple of
years, thereby sustaining the value of incomes
in the hands of people and leading to better
quality livelihoods (Figure 1.1). In its latest
Monetary Policy, RBI stated that the con-
sumer price index (CPI) inflation had eased
across the board over the first five months of
2015–16. The distribution of inflation across
major sub-groups implied that the ongoing
disinflation was broad-based. The easing of
inflationary pressures was sufficient for RBI
to reduce its repo rate by 50 basis points,
bringing down the rate to 6.75 per cent.
5
Some banks have already announced a reduc-
tion in their base rate as a consequence; the
resultant decrease in interest rates is expected
to lower finance costs and induce invest-
ments. The expected investments that will
follow the rate cut will positively impact the
livelihoods situation in the country.
The votaries of trickle down theories
find it difficult to explain the weak impact
of robust macroeconomic growth on
employment and livelihoods of the poor
on the ground. While job growth has been
positive, it has been at a very low rate. The
high GDP numbers did not translate to
high levels of employment growth (jobless
growth)
6
which exacerbates the gap between
the rich and the poor. A cause for concern is
that new livelihoods, especially in the form
of jobs are not created at a rate adequate to
meet the increasing supply of labour force.
The
Economic Survey 2015
points out:
Regardless of which data source is used, it
seems clear that employment growth is lag-
ging behind growth in the labour force. For
example, according to the Census, between
2001 and 2011, labour force growth was 2.23
per cent (male and female combined). This
is lower than most estimates of employment
growth in this decade of closer to 1.4 per cent.
Creatingmore rapid employment opportuni-
ties is clearly a major policy challenge.
4
RBI Annual Report 2014–15, RBI 2015.
Table 1.1:
Savings and capital formation rates
(2011–12 Constant
prices)
2012–13 2013–14 2014–15
Gross savings rate as %
of GDP
31.1
30 Yet to be
released
by CSO
Gross fixed capital
formation as % of GDP
31.9 30.7
30
GDP growth rate % 5.1
6.9
7.3
Source:
Central Statistical Office, Ministry of Statistics
and Programme Implementation, GoI.
Per cent
0
Jun–14
All groups
Fuel and light
Food & beverages
CPI-Excluding food and fuel
Jul–14
Aug–14
Sep–14
Oct–14
Nov–14
Dec–14
Jan–15
Feb–15
Mar–15
Apr–15
May–15
Jun–15
Jul–15
Aug–15
2
4
6
8
10
5
The last time repo rate was at this level was in
March 2011.
6
‘GDP growth does not translate in to proportion-
ately more jobs’,
Economic Survey 2014–15
.
Figure 1.1:
Inflation behaviour–CPI year-on-year
Source:
Excerpted from Monetary Policy Report, September 2015, RBI.


