Some Important Programmes in Livelihoods: Searching for Focus?
33
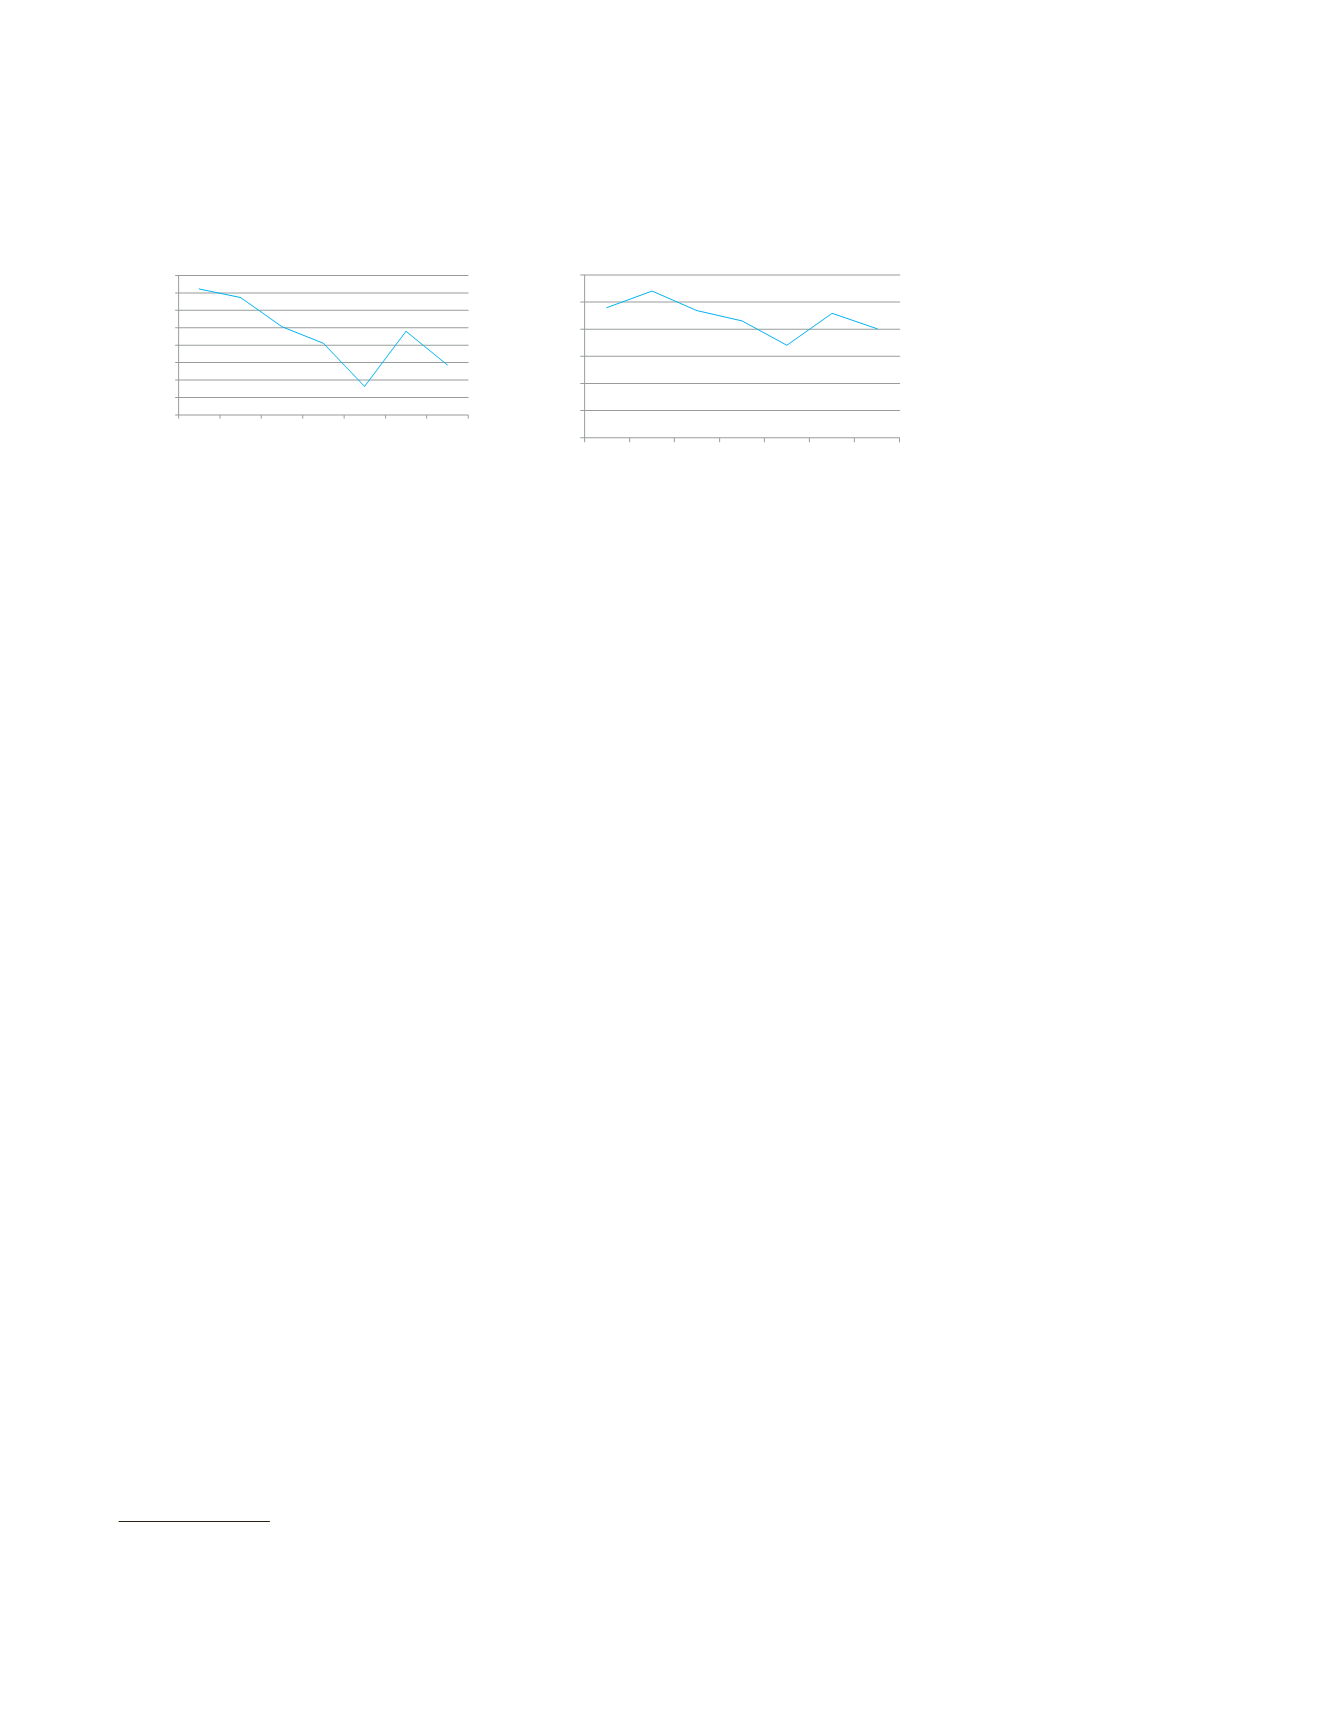
reported that apart from low wages and
delayed payments, work is not available
when people need it most. The propor-
tion of households to which 100 days of
employment was provided fell to as low
as 3.29 per cent in 2012–13 and again to
5.75 per cent in 2014–15 (Figure 3.3). A
national programme that
guarantees
100 days
employment, fulfilling the guarantee only to
5.75 per cent households requires a serious
re-examination. Back of the envelope calcula-
tions show that
to provide 100 days of work
to all households that demanded jobs during
2014–15, the wage budget would have cost
`
767.25 billion
.
7
The current allocations are
less than 50 per cent of the required budget
and reflect gross underfunding. Given the
fiscal space, it does not seem feasible to fulfil
the statutory guarantee in the near future.
In 2014–15, 1662.7 million person days
of work had been provided under NREGS.
There has been a steady decline in the
number of days of work generated under
the scheme from 2012–13 onwards. The
average number of days of employment pro-
vided per household also has been declining
steadily. From a peak of 54 days per year per
household in 2009–10, it has declined to
40.16 days in 2014–15 (Figure 3.4).
There is considerable variation in the
scheme implementation efficiency across
states (Annexure 2 at the end of the chapter
provides comparative data of states on
some aspects of scheme implementation).
Fourteen states allocated far more person
days of work than budgeted. At the coun-
try level, the person days allocated during
2014–15 was 109 per cent of the budget.
States such as AP, Kerala and Puducherry
allocated 200 per cent to 350 per cent of the
budgeted person days. At the other end of
the spectrum, states of West Bengal, Jammu
and Kashmir, Madhya Pradesh, Bihar,
Meghalaya and Manipur allocated between
50 per cent and 9 per cent of the budget to
the households (Figure 3.5).
While the budget itself was low in some
of these states, in others the budget was sub-
stantial. Allocations in excess of budget led
to cornering the NREGS resources by a few
states (Table 3.3). The top five states in terms
of person days allocated took up more than
70 per cent of all India person days allocated.
There was a gap between the work
allocated to households against demand
and actual work taken up by households.
Unsuitable timing seems to be amajor factor
for this gap as per social audits.
Wage Payments
While IT systems have been in place to deal
with timely payment of wages, delays con-
tinue to plague the scheme. In 2014–15, 27
per cent of all wage payments were made in
time. About 72 per cent of all payments were
delayed beyond 15 days (Table 3.4). Sixteen
per cent of payments were delayed by more
than three months. Though there is a provi-
sion for compensation to beneficiaries for
Figure 3.3:
Per cent of households with 100
days employment
Figure 3.4:
Average number of days per
household
Source:
NREGS MIS sourced from MoRD website.
Source:
Graph by authors based on data from NREGS
MIS.
14.46%
13.47%
10.12%
8.23%
3.29%
9.63%
5.75%
0.00%
2.00%
4.00%
6.00%
8.00%
10.00%
12.00%
14.00%
16.00%
2008
–09
2009
–10
2010
–11
2011
–12
2012
–13
2013
–14
2014
–15
48.0
54.0
47.0
43.0
34.0
46.0
40.2
0.0
10.0
20.0
30.0
40.0
50.0
60.0
2008
–09
2009
–10
2010
–11
2011
–12
2012
–13
2013
–14
2014
–15
7
Calculations by the authors. Based on
`
165 per
day wage and 4.52 million households demanding
work in 2014–15.


