bu i ld i ng an i nc lu s i ve f i nanc i a l s e ctor i n i nd i a
103
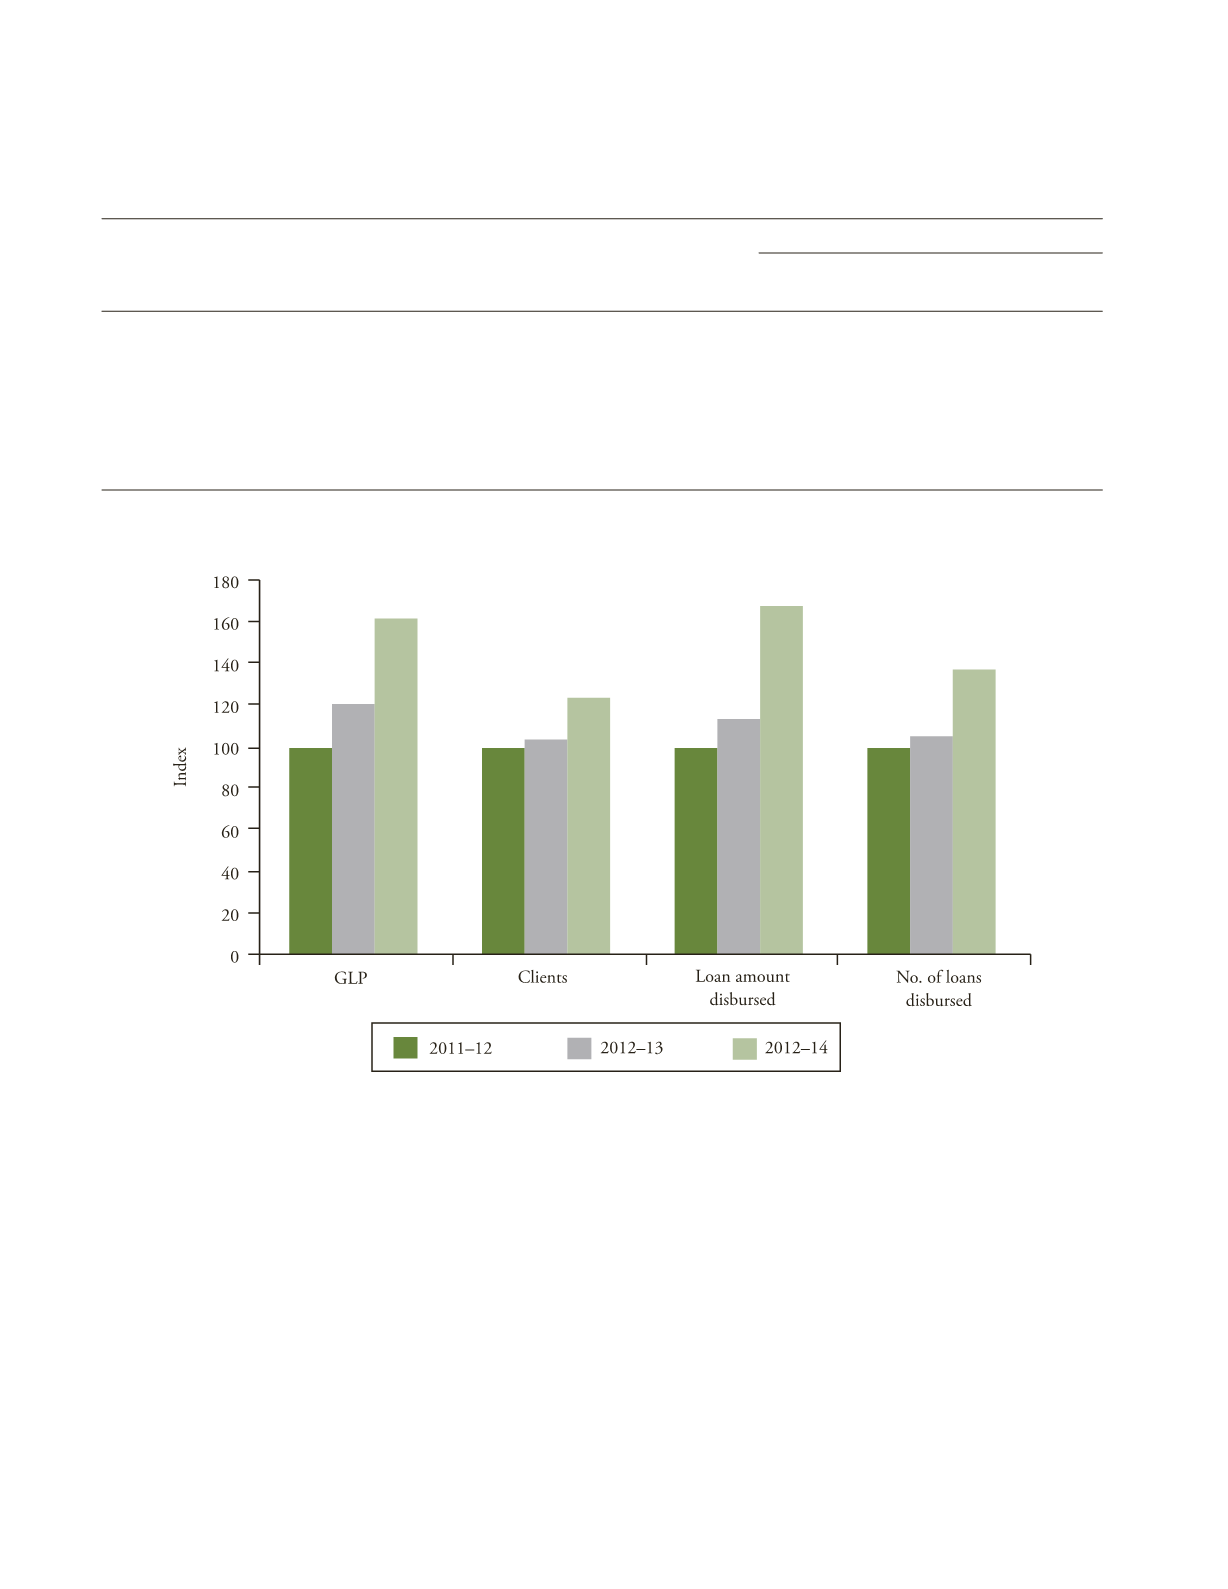
Figure 4.9 presents the direction of growth in NBFCs
over the triennium 2011/12–2013/14 captured through
index numbers with 2011–12 as the base year.
The structure of the NBFC-MFI sector is clearly
top heavy. The smaller NBFCs (having GLP below one
billion) with 70 per cent share in number has only 14 per
cent share in GLP (Table 4.17 and Figure 4.10). The nine
NBFCs with portfolio above Rs. 1000 crore make up for
75 per cent of the sector’s overall GLP, with the top two—
Bandhan and SKS—accounting for about 45 per cent.
In terms of growth as Figure 4.10 shows the medium
sized MFIs (GLP 1–5 billion) are found to be the most
dynamic. Those with GLP below 1 billion have grown at
constant rates over the period 2011/12–2013/14.
It is difficult to have such standardized data for the
non-profit segment of the microfinance industry. The
MIX has data relating to more than 160 MFIs. The data
on MFIs presented here has been compiled from the MIX
database for the reporting periods 2012–13 and 2013–
14. Since annual data was not available for all MFIs for
T
ABLE
4.16
Growth of NBFC-MFIs: Major Indicators
Parameters
2011–12
2012–13
2013–14
Growth rate
2011–12 to
2012–13 to
2011–12 to
2012–13
2013–14
2013–14
Gross loan portfolio (Rs. bn)
173.83
207.26
279.31
19.23
34.76
60.68
Clients (mn)
22.74
23.3
28.04
2.46
20.34
23.31
Loan amount disbursed (Rs. bn)
209.51
236.86
349.68
13.05
47.63
66.90
Number of Loans disbursed (mn)
17.65
18.57
24.38
5.21
31.29
38.13
Branches
9,777
9,103
9,780
–6.89
7.44
0.03
Employees
72,985
61,746
67,838
–15.40
9.87
–7.05
Loan officers
45,556
40,280
44,400
–11.58
10.23
–2.54
Source
: MFIN (2014).
F
IGURE
4.8
Growth in NBFC-MFIs: 2011–12 to 2013–14


