i nc lu s i ve f i nanc e i nd i a re port 2014
104
2013–14, only those MFIs are included in the analysis
for which (a) the latest data available was for the quarter
ending 31 December 2013; and (b) annual data is
available as on 31 March 2014. In one case—that of
BISWA—the data for the second quarter of 2013 has
been used.
Importantly, the NGO MFI segment too is heavily
skewed with just one MFI—Shree Kshetra Dharmasthala
Rural Development Project (SKDRDP)—accounting for
about half of all the borrowers and almost 60 per cent of
the portfolio. Since we have considered SKDRDP along
with the other major players—Cashpor, BISWA and
Sanghamitra—in both the years, the data can be said to
represent the actual trends quite closely.
Table 4.18 indicates that the non-profit MFIs grew
their GLP by 40 per cent and borrower base by 23
per cent. There has been some growth in human resources
and physical infrastructure too. What is critical about
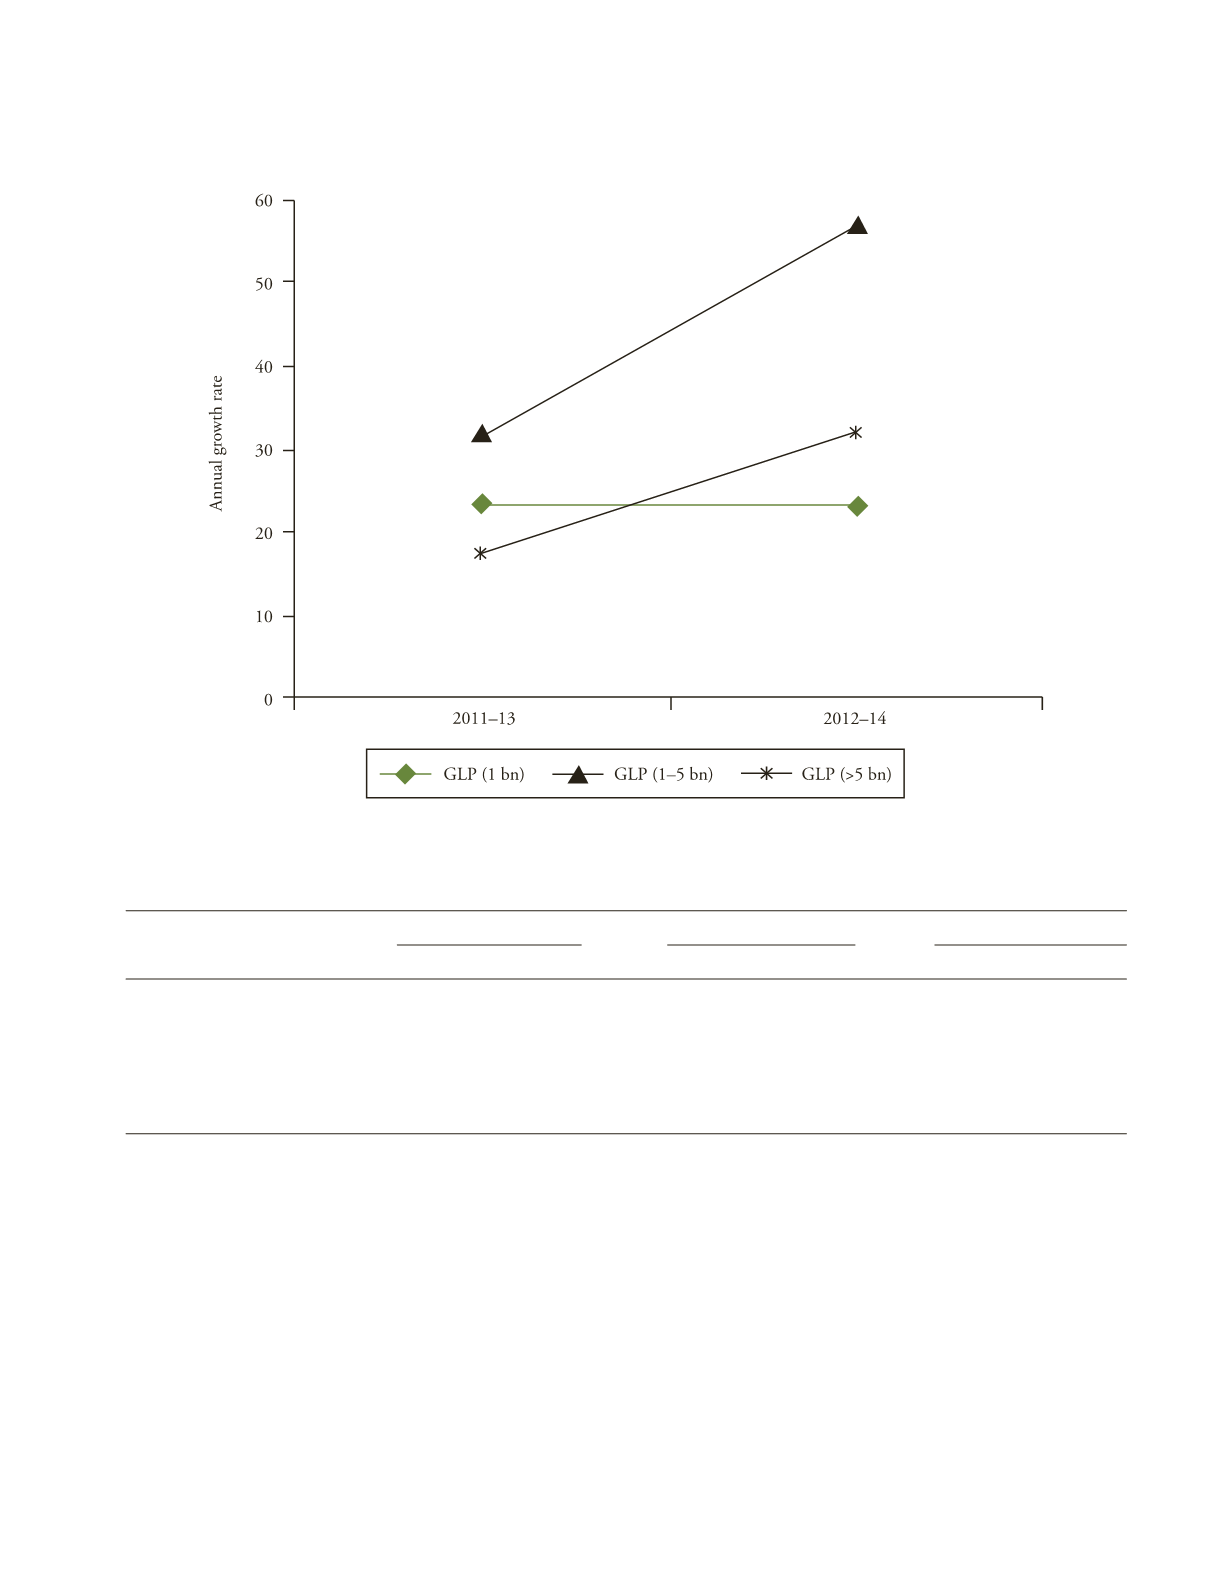
F
IGURE
4.9
Growth Rates by GLP Size Class
Table 4.17
Structure of the NBFC-MFI Sector
Year
<1 bn
1 to 5 bn
> 5 bn
GLP
Clients
GLP
Clients
GLP
Clients
2011–12
3.91
0.68
19.35
3.13
150.56
18.94
2012–13
4.82
0.77
25.55
2.99
176.89
19.55
2013–14
5.93
0.73
40.06
4.09
233.32
23.22
Growth rate
2011–13
23.27
13.24
32.04
–4.47
17.49
3.22
2012–14
23.03
–5.19
56.79
36.79
31.90
18.77
Source
: MFIN (2014).


