bu i ld i ng an i nc lu s i ve f i nanc i a l s e ctor i n i nd i a
107
T
ABLE
4.21
Flow of Bank Funds to MFIs
Financing agency
Year
Loans disbursed to MFIs during the year
Loan outstanding against MFIs
No. of MFIs
Amount
No. of MFIs
Amount
(Rs. crore)
(Rs. crore)
Commercial banks
2010–11
460
7,601
2,153
10,647
2011–12
36
4,951
1,684
9,811
2012–13
368
7,423
1,769
12,468
2013–14
481
9,379
2,241
14,120
RRBs
2010–11
9
4
23
42
2011–12
113
13
128
38
2012–13
14
5
153
71
2013–14
16
163
124
222
Cooperative banks
2010–11
2011–12
4
2
19
5
2012–13
3
4
18
7
2013–14
4
4
17
8
SIDBI
2010–11
2
844
139
3,042
2011–12
12
239
129
1,597
2012–13
41
408
102
1,881
2013–14
41
646
84
1,980
All agencies
2010–11
471
8,449
2,315
13,731
2011–12
465
5,205
1,960
11,450
2012–13
426
7,840
2,042
14,426
2013–14
545
10,282
2,422
16,517
Source
: Nair and Tankha (2014); NABARD (2014).
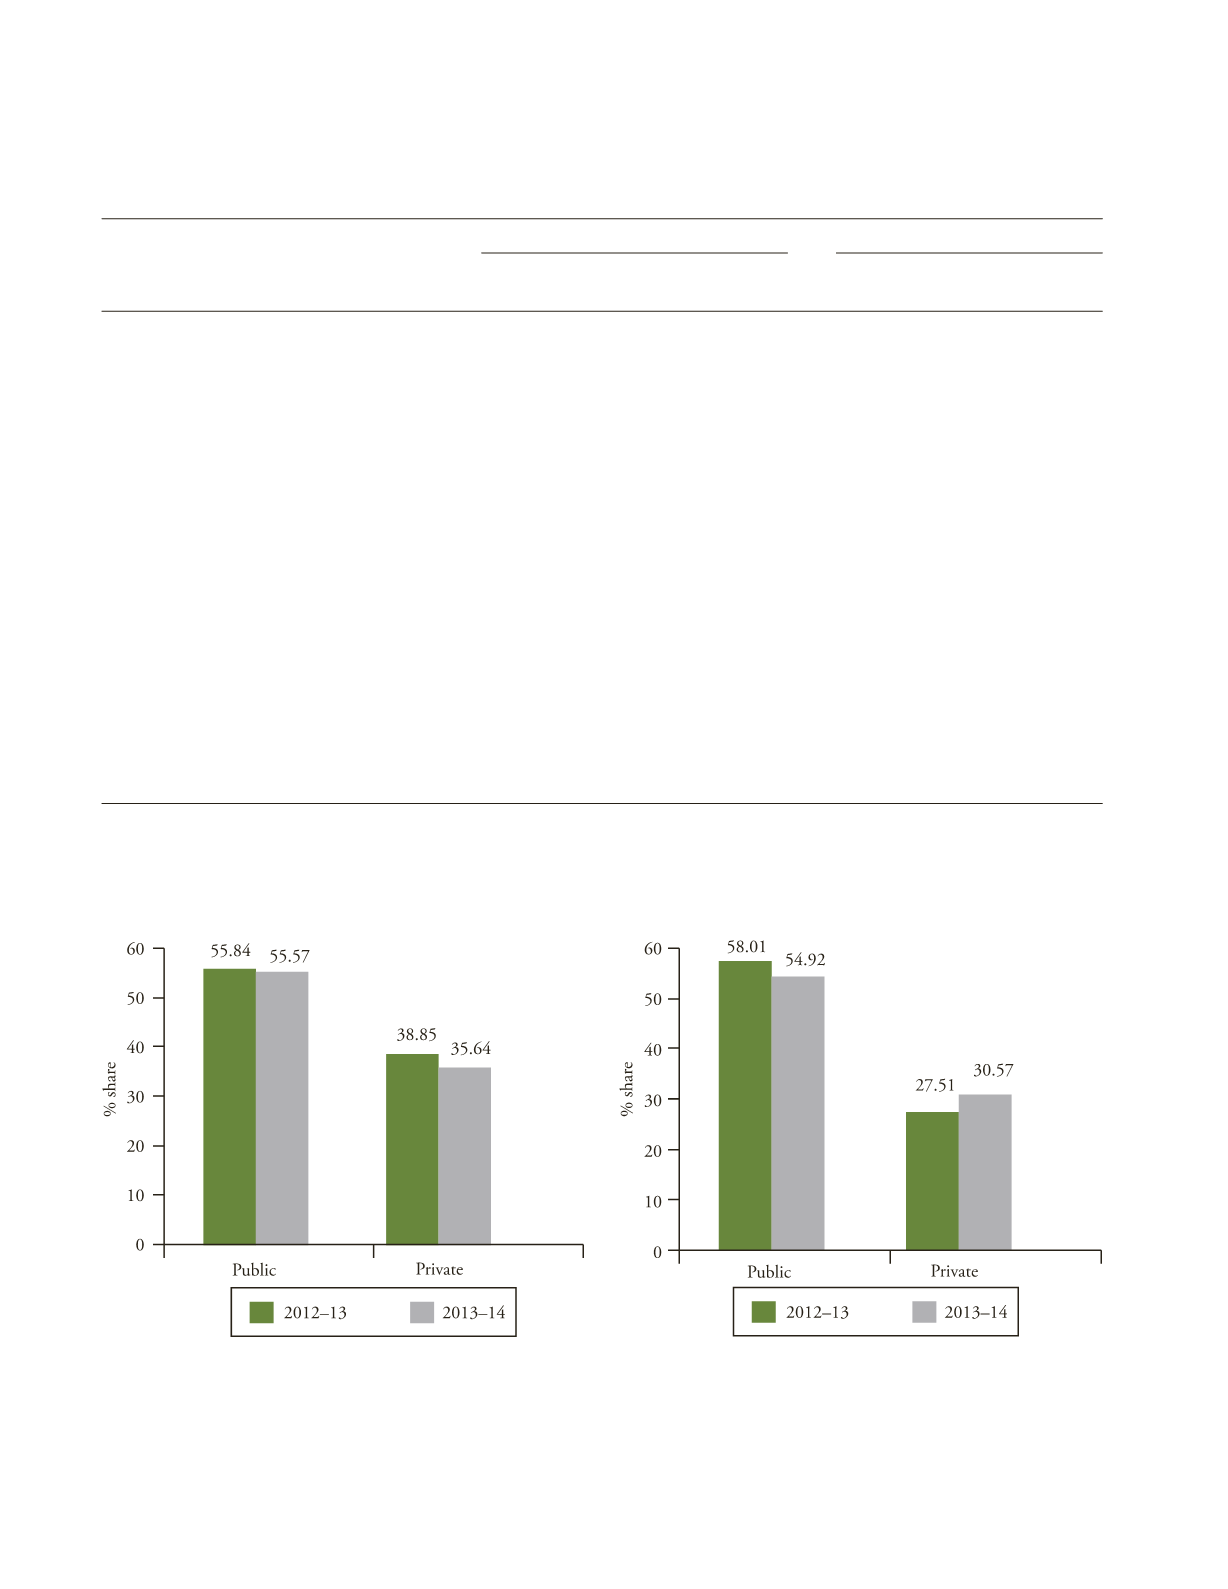
F
IGURE
4.10
Share of Public and Private Sectors in Bank Loan
Disbursed to MFIs
Source
: Same as Table 4.10.
F
IGURE
4.11
Share of Public and Private Sectors in Outstanding
Bank Loans against MFIs
Source
: Same as Table 4.10.


