131
401-478) which had C-D ratios of less than 20%, but in March 2000, there
were as many as 105 districts (out of 565) within this lowest range of C-D ratios
(Table 4.40). It is heartening to find that thereafter the number of districts
having such lowest C-D ratios has dwindled to as low a figure as 28 in March
2010 and 36 in March 2011.
Classification of districts by their C-D ratios and by states reveals an
interesting picture (Annexure G). As presented in a summary table (Table
4.41) as of March 2006, north-eastern, eastern and central regions have their
districts concentrated in low C-D ratio loops, while the western region districts
appear somewhat spread out across various C-D ratio ranges. The southern
region enjoys the distinction of its districts being concentrated in high C-D
ratio loops (Table 4.41; see also Annexure H).
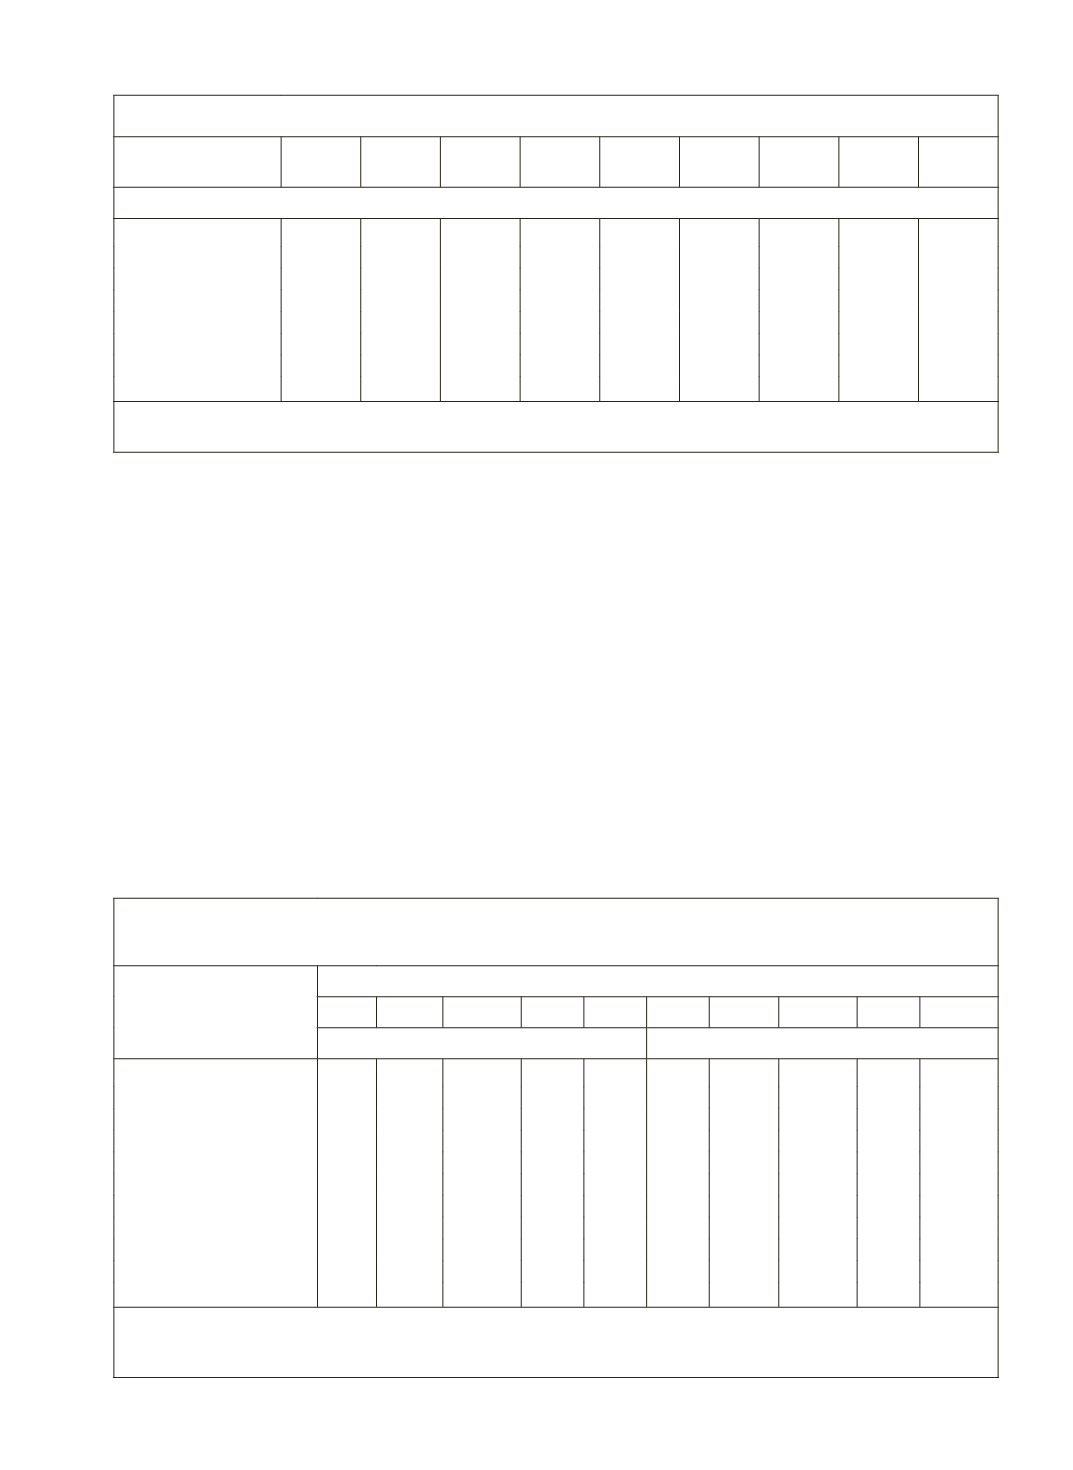
Table 4.40: Classification of Districts By Range of C-D Ratios (per cent)
C-D Ratio Range
(Per cent)
March
2011
March
2010
March
2006
March
2005
March
2004
March
2000
March
1990
March
1985
March
1980
Number of Districts
< 20
36
28
28
54
79 105
28
20
29
20 – 30
116 112
69
97 117 130
49
37
59
30 – 40
102 106
67 105 127
97
71
71
64
40 – 50
95
91
88
84
83
85
60
49
64
50 – 60
73
87
62
87
73
47
69
41
49
60 – 100
155 158 196 149
98
87 142 157 114
> 100
56
49
91
23
12
14
35
52
22
Total
633 631 601 599 589 565 454 427 401
Source:
Classification compiled by EPWRF from district-wise data contained in RBI(2011), Banking Statistics:
Basic Statistical Returns of Scheduled Commercial Banks in India, March 2011 (Vol.40) and earlier issues
Table 4.41: Region/State-wise Classification of Districts by Range of C-D Ratios
across Regions/Selected States
Region/State
Range of C-D Ratios as per Utilisation
0-40 41-60 61-100 >100 Total 0-40 41-60 61-100 >100 Total
Number of Districts, 2006
Number of Districts, 2003
Northern Region
23 20
41 13 97 43 26
24
4
97
North-Eastern Region
22 25
19 13 79 44 14
8
5
71
Eastern Region
54 26
24 11 115 73 26
12
2 113
Central Region
54 46
33 14 147 87 33
20
3 143
Western Region
7 13
33 11 64 18 10
29
7
64
Southern Region
4 20
46 29 99 15 30
40 14
99
India
164 150 196 91 601 280 139 133 35 587
Bihar
23
8
3
4 38 32
6
-
-
38
Jharkhand
20
1
1
-
22 17
2
1
-
20
Madhya Pradesh
10 15
15
8 48 17 15
11
2
45
Orissa
1
9
14
6 30
6 14
8
2
30
Note:
C-D denotes Credit-Deposit
Source:
Computed by EPWRF from RBI,
Basic Statistical Returns of Scheduled Commercial Banks in India,
2003
and
2006
. For details, See Annexure H


