133
have slipped from 0.67% to 0.23% between March 1992 and March 2006 in
the case of Maharashtra and from 6.4% to 4.9% in the case of Andhra Pradesh
(Table 4.42). Likewise, in the case of Karnataka and West Bengal, the shares
of the bottom districts have fallen from 6.2% to 2.2% and from 3.3% to 2.7%,
respectively.
High C-D Ratio is Associated with High Agricultural Credit Share
The objective of reviewing the C-D ratios of a few chosen districts of
selected states has been to bring home that there is some correlation between
C-D ratios and agricultural credit share in total bank credit in the chosen
districts. As shown in Annexures U(A), U(B), U(C) and U(D), in all the four
states of Maharashtra, Andhra Pradesh, Karnataka and West Bengal and in all
the three years of 1992, 2004 and 2011, the top districts with high agricultural
credit share generally coincide with the high C-D ratios, implying that better
credit base created by banks tends to expand credit delivery for agriculture (see
also Table 4.43). This is also brought out by a scatter diagram using the C-D
ratios on Y-axis and agricultural credit share on X-axis (both in percentages as
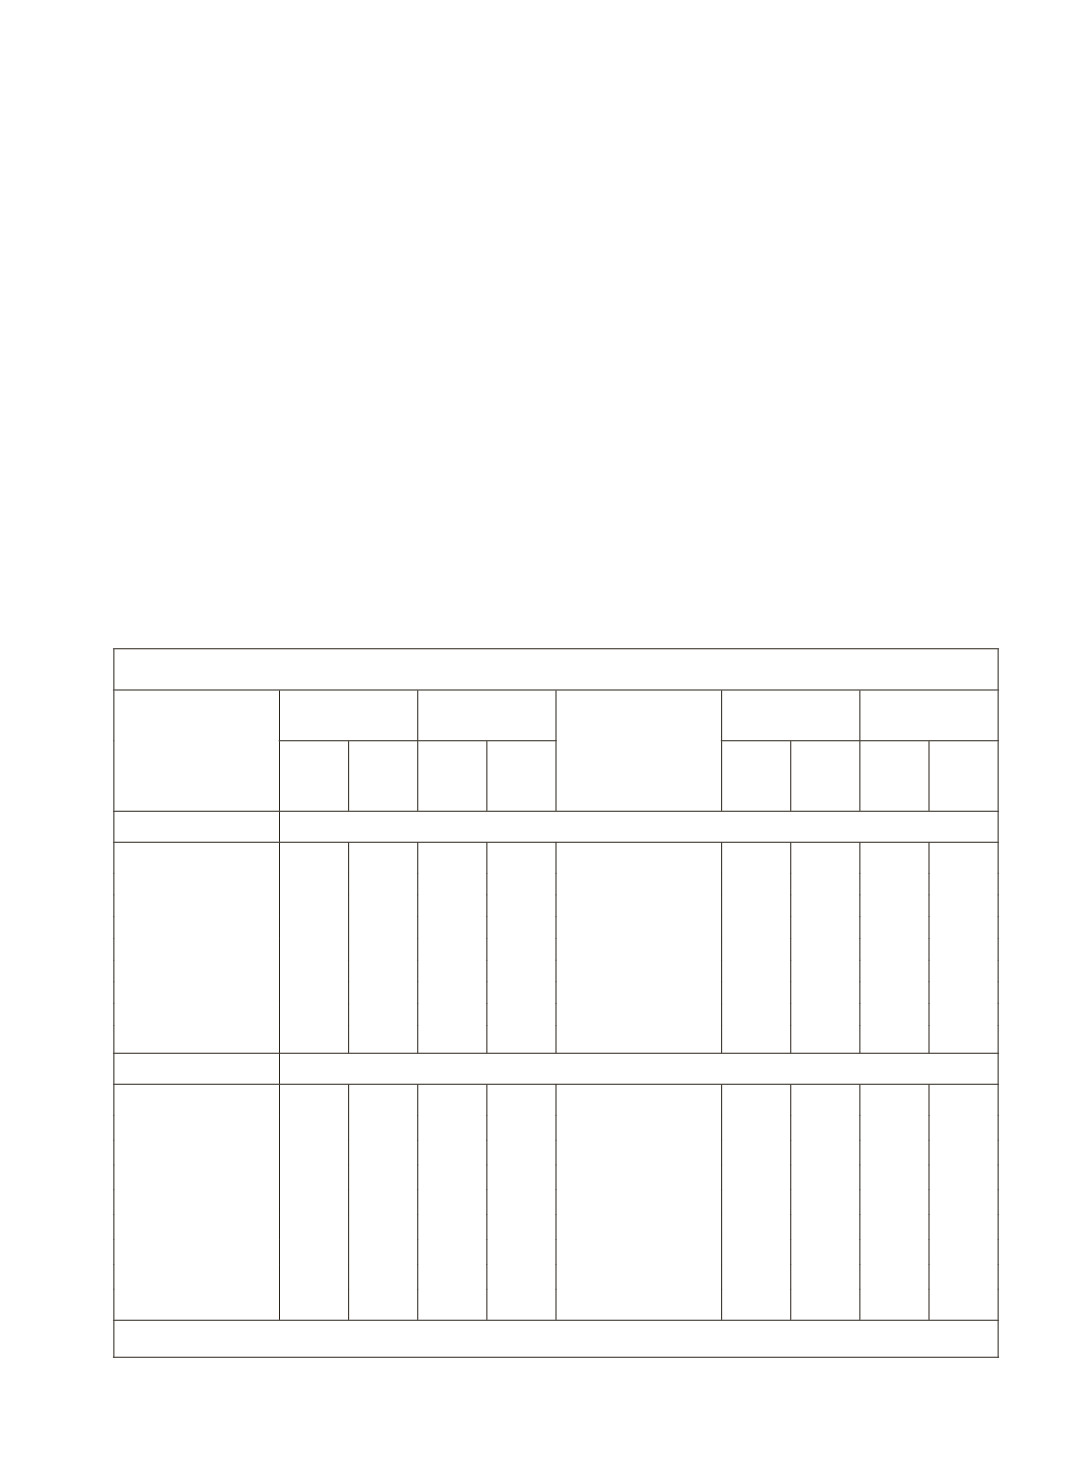
Table 4.43: District-wise Aggregate Deposits and Bank Credit
Districts
End of
March 2006
End of
March 1992
Districts
End of
March 2006
End of
March 1992
Credit
Share
(in%)
Credit-
Deposit
Ratio
Credit-
Share
(in%)
Credit-
Deposit
Ratio
Credit
Share
(in%)
Credit-
Deposit
Ratio
Credit-
Share
(in%)
Credit-
Deposit
Ratio
A. Maharashtra and Andhra Pradesh
Maharashtra
Andhra Pradesh
State total
100.0 81.3 100.0 60.7 State total
100.0 86.2 100.0 80.1
Top 5 districts
92.4 81.3 89.9 60.5 Top 5 districts
65.8 92.4 59.3 91.2
Mumbai
80.6 82.0 79.5 61.2 Hyderabad
42.8 95.9 36.3 101.3
Pune
5.6 75.0 5.4 66.9 Visakhapatnam 6.3 48.7 6.7 65.5
Thane
2.9 61.0 1.7 32.4 East Godavari
5.9 145.5 6.0 80.7
Raigad
2.0 236.5 2.1 56.6 Krishna
5.7 109.2 5.8 71.2
Nagpur
1.4 58.2 1.2 69.2 Guntur
5.1 117.7 4.5 132.6
Bottom 5 Districts
0.23 51.7 0.67 35.2 Bottom 5 Districts
4.9 61.3 6.4 55.5
B. Karnataka and West Bengal
Karnataka
West Begal
State total
100.0 93.4 100.0 84.8 State total
100.0 63.6 100.0 51.0
Top 5 districts
78.0 96.8 70.0 78.1 Top 5 districts
84.8 66.4 81.8 49.8
Bangalore Urban
61.5 90.4 46.7 85.1 Kolkata
71.5 79.6 64.1 51.7
Bangalore Rural
7.4 596.6 8.8 57.0 Barddhaman
3.8 36.5 4.0 29.1
Dakshin Kannada
3.3 58.4 5.8 94.9 North 24 Paraganas
3.4 20.1 4.9 40.7
Bellary
3.1 157.0 4.5 65.8 Paschim Medinipur
3.2 82.5 4.5 57.4
Mysore
2.8 74.1 4.2 66.2 Haora
2.9 43.4 4.3 62.4
Bottom 5 Districts
2.2 84.8 6.2 67.2 Bottom 5 Districts
2.7 43.3 3.3 47.9
Source:
RBI,
Basic Statistical Returns
, March 1992 and March 2006.


