59
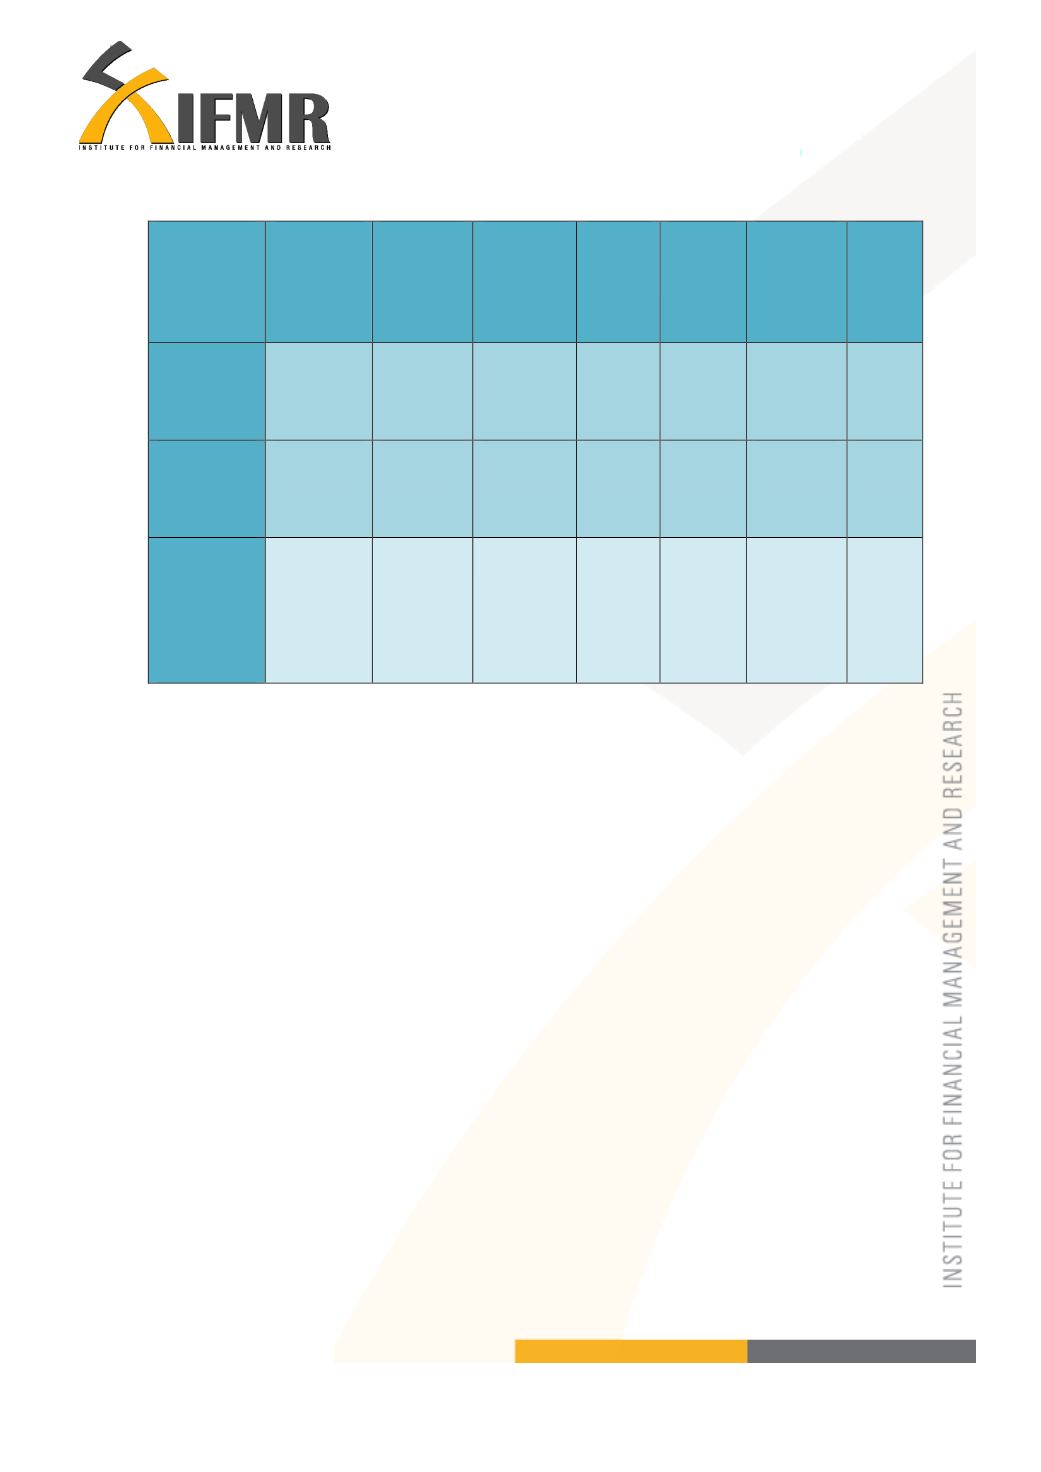
Table10.3
Karnataka - Expenditure of the SHG member (household)
Househol
d routine
expenses
(monthly
)
Travel
(monthly
)
Educatio
n
(yearly)
Health
(yearly
)
Festiva
l
(yearly
Function
s
(yearly)
Other
s
Mean
4,548.67
983.62 12,720.28
5,142 9,578.3
3
4,747.03 58.72
Standard
deviation
2,396.10
997.85 15,810.77
8,160 7,419.7
4
7,814.38 604.8
7
Number of
observation
s
300
298
217
300
300
185
298
Tables 10.2 and 10.3 show us the patterns in expenditure in the households both in Tamil
Nadu and Karnataka. There are two components to the way households spend. One
component is routine and is monthly which is depicted in the first two columns. This
consists of groceries, everyday items as well as travel expenditure. Most households do
not borrow for this expenditure as this is the basis for their present standard of living.
However, most households would either borrow or save to fund the educational needs of
their children, health expenditure of a family member or to fund for a festival/function
due to social pressure. Put differently, members would save at least for known
expenditure. Given the habit of saving, particularly after joining the SHG group, the
important matter to investigate is the need to save. The above data shows differences in
average expenditure in Tamil Nadu Karnataka. Is this significant?


