51
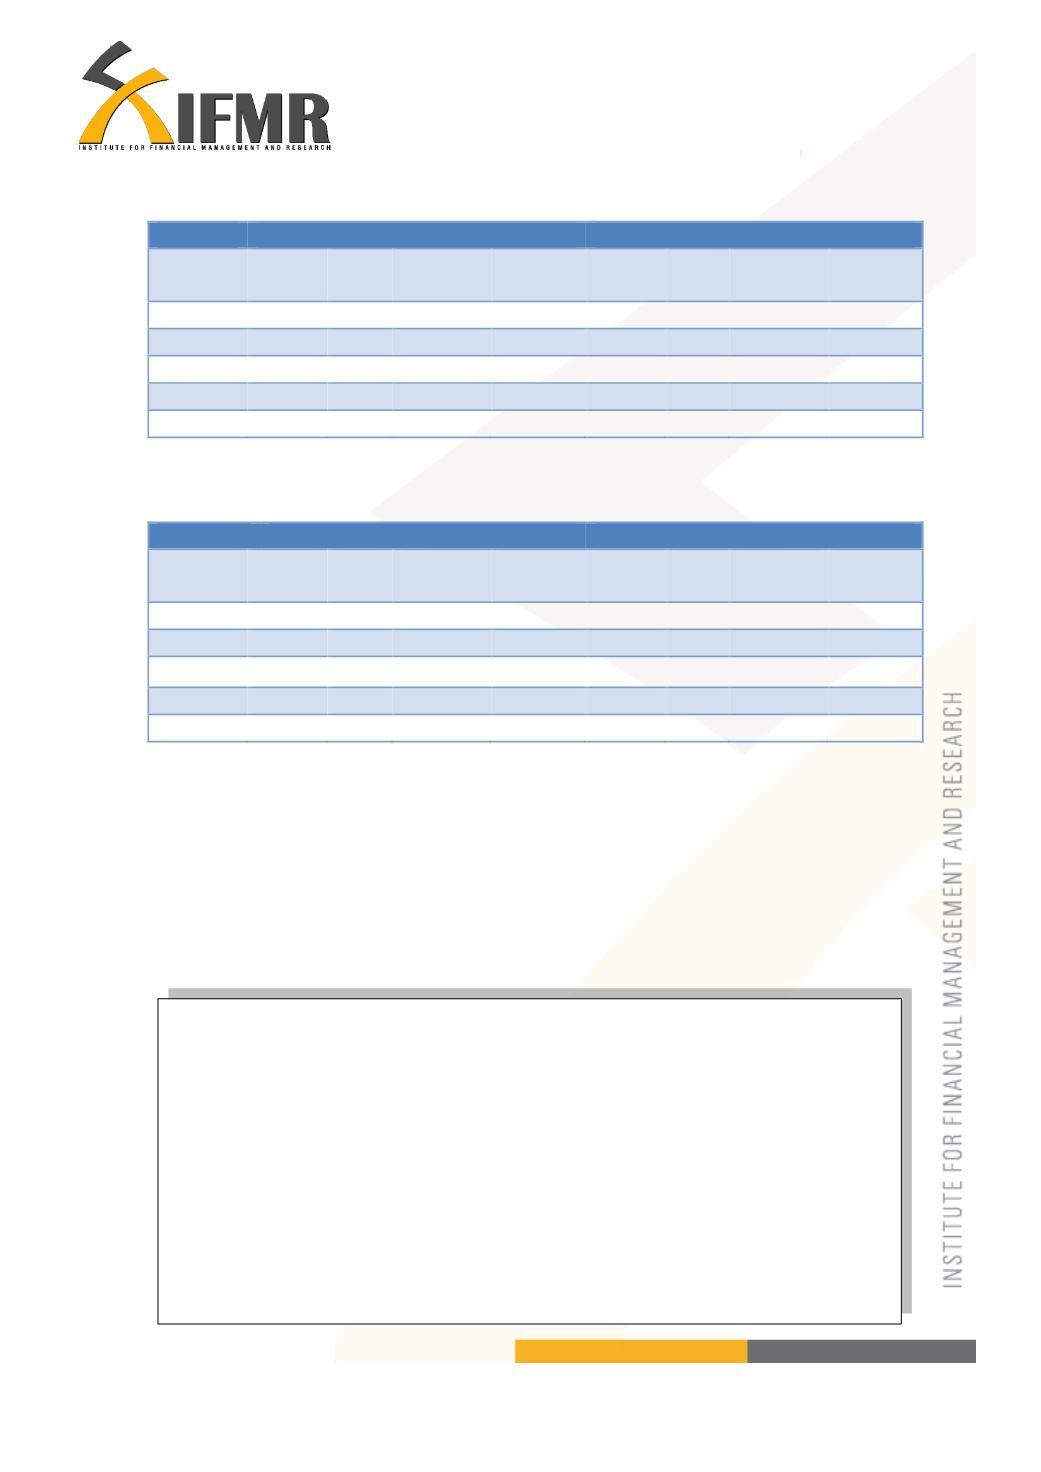
Table 8.5
Relation between savings and dream goals Karnataka
Child 1 education
Child 2 education
Savings Loan Selling
Properties
Mortgage Savings Loan Selling
Properties
Mortgage
Quintile1
8%
25%
1%
2%
3%
10% 0%
1%
Quintile2
18%
14%
0%
1%
17%
22% 0%
0%
Quintile3
18%
14%
1%
1%
15%
10% 0%
2%
Quintile4
22%
20%
1%
0%
57%
18% 1%
0%
Quintile5
70%
52%
0%
0%
35%
72% 1%
0%
Table 8.6
Relation between savings and dream goals Karnataka
Marriage
House related
Savings Loan Selling
Properties
Mortgage Savings Loan Selling
Properties
Mortgage
Quintile1
4%
19%
0%
60%
2%
19% 0%
1%
Quintile2
6%
19%
0%
18%
10%
12% 1%
0%
Quintile3
19%
21%
1%
10%
18%
22% 0%
1%
Quintile4
21%
26%
0%
1%
10%
18% 1%
0%
Quintile5
50%
50%
0%
0%
32%
24% 0%
0%
Table 8.5 and 8.6 shows that in Tamil Nadu, the bottom 20% of the members saved less,
and hence was more dependent on mortgage as compared to loans. Also it shows that the
top 20% of members saved greater amounts and depended on loans for their dream goals.
The same can be seen for Karnataka too in Tables 8.7 and 8.8. The dream goals in Tamil
Nadu and Karnataka are educational expenses, marriage and household expenses.
Key Findings
There are a significant percentage of members who are either unemployed or
are housewives. To them being a member is more for a social reason and the
benefits from saving.
Most members were saving for their child’s education, household
expenditure and marriage expenses.
Members with greater savings took loans from groups while members with
low savings used the mortgage route.


