82
The share of credit to small farmers has risen more or less in proportion
to the area operated by them. On the other hand, the share of large farmers in
total credit has gone up although their share in area has remained the same
(Table 4.14).
In this respect, a telling picture revealed by the NSSO’s Situation
Assessment Survey of Farmers, 2003 is worth noting. As shown in Table 4.15
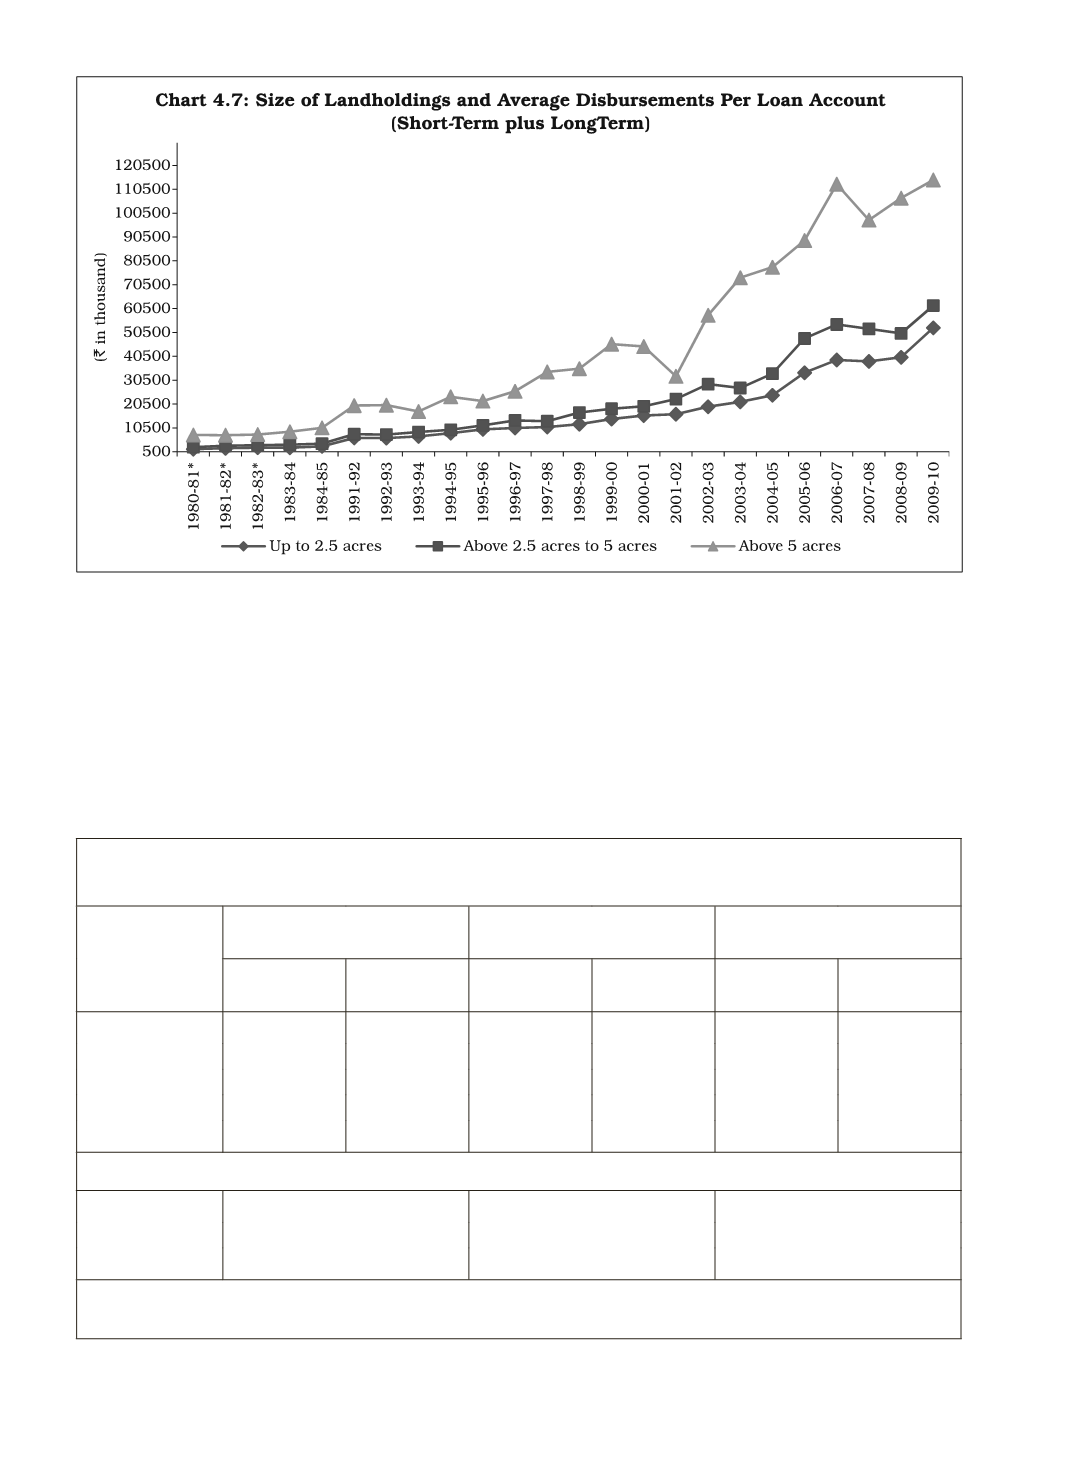
Table 4.14: Distribution of Scheduled Commercial Banks’ Outstanding Credit
to Farmer Households According to Size of Holdings
Year
(at end June)
Up to 2.5 Acres
Above 2.5 Acres
Up to 5 Acres
Above 5 Acres
No of
Accounts
Amount
No of
Accounts
Amount
No of
Accounts
Amount
1981-82
50.59
27.77
24.61
20.66
24.80
51.57
1991-92
45.42
28.79
31.43
24.87
23.15
46.34
2002-03
38.90
22.12
30.17
25.52
30.93
52.36
2003-04
42.83
24.94
31.10
23.02
26.07
52.04
2004-05
44.00
26.30
31.10
25.70
24.90
48.00
Ratio of share of credit disbursed to share of area operated
1981-82
1.02
0.82
1.08
1991-92
0.54
0.75
1.42
2002-03
0.41
0.80
1.40
Source:
RBI, Handbook of Statistics on the Indian Economy, 2005-06 and National Sample Survey
Organisation (NSSO), Some Aspects of Operational Land Holdings in India, Various Rounds.


