34
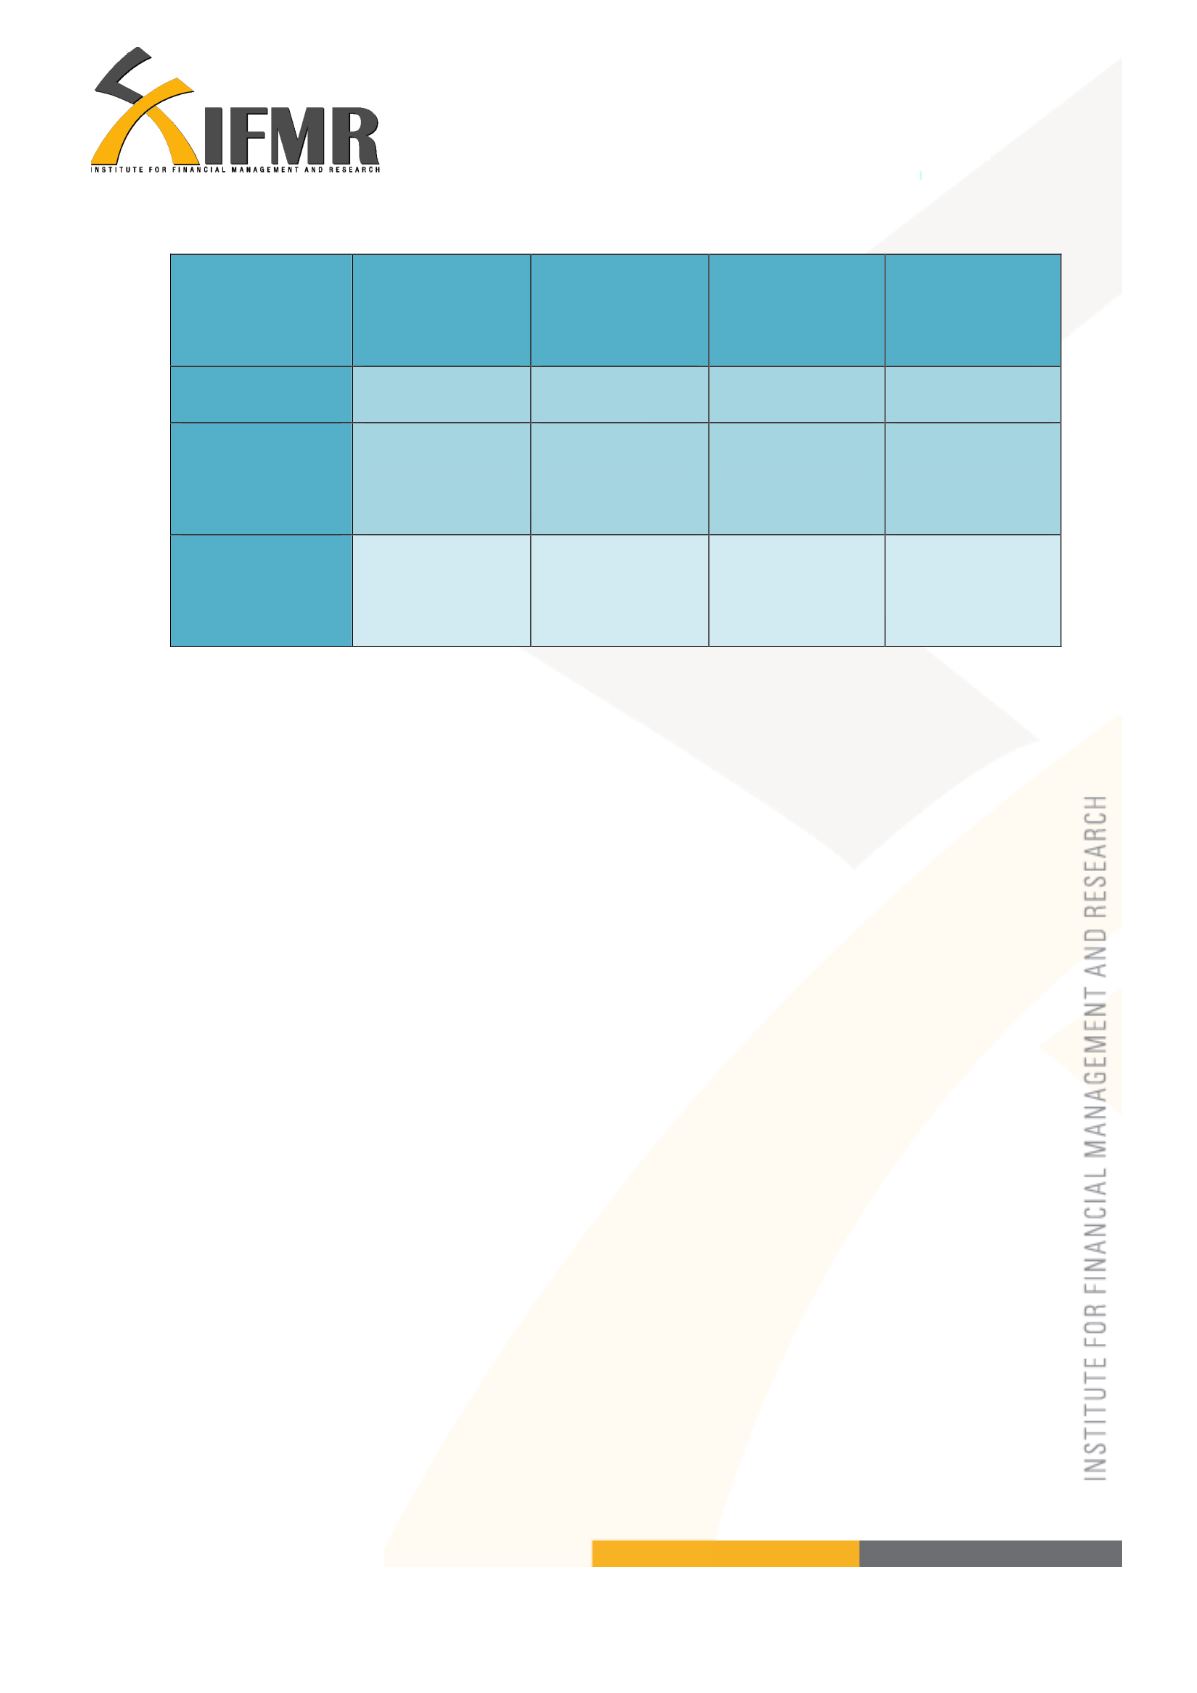
Table 6.4: Karnataka - Household income (monthly)
Primary
occupation
Secondary
occupation
Total
NREGA*
Mean
13,706.33
4,937.50
18,643.83
1,206.25
Standard
deviation
10,810.78
3,275.47
2,418.87
Number of
observations
300
12
2
*SHG member’s income is part of household income, therefore not added in total separately. In case of NREGA
income, annual estimates are converted to monthly
Tables 6.3 and 6.4 clearly indicate that the average household income in both the states is
almost the same, being around Rs. 18, 000. This income supports about 4-5 members
and in spite of members individual incomes being low their family incomes are not all
that low. Hence we feel that this income does show a potential to save and is connected
to the kind of occupation they are pursuing and the amount of expenditure they have per
month. It is hence important to know what occupations these members are involved in as
this gives us an understanding of their skill level and their potential to save too. By
analyzing their occupation we also understand the sources of their income and livelihood
and what further potential it offers.


