36
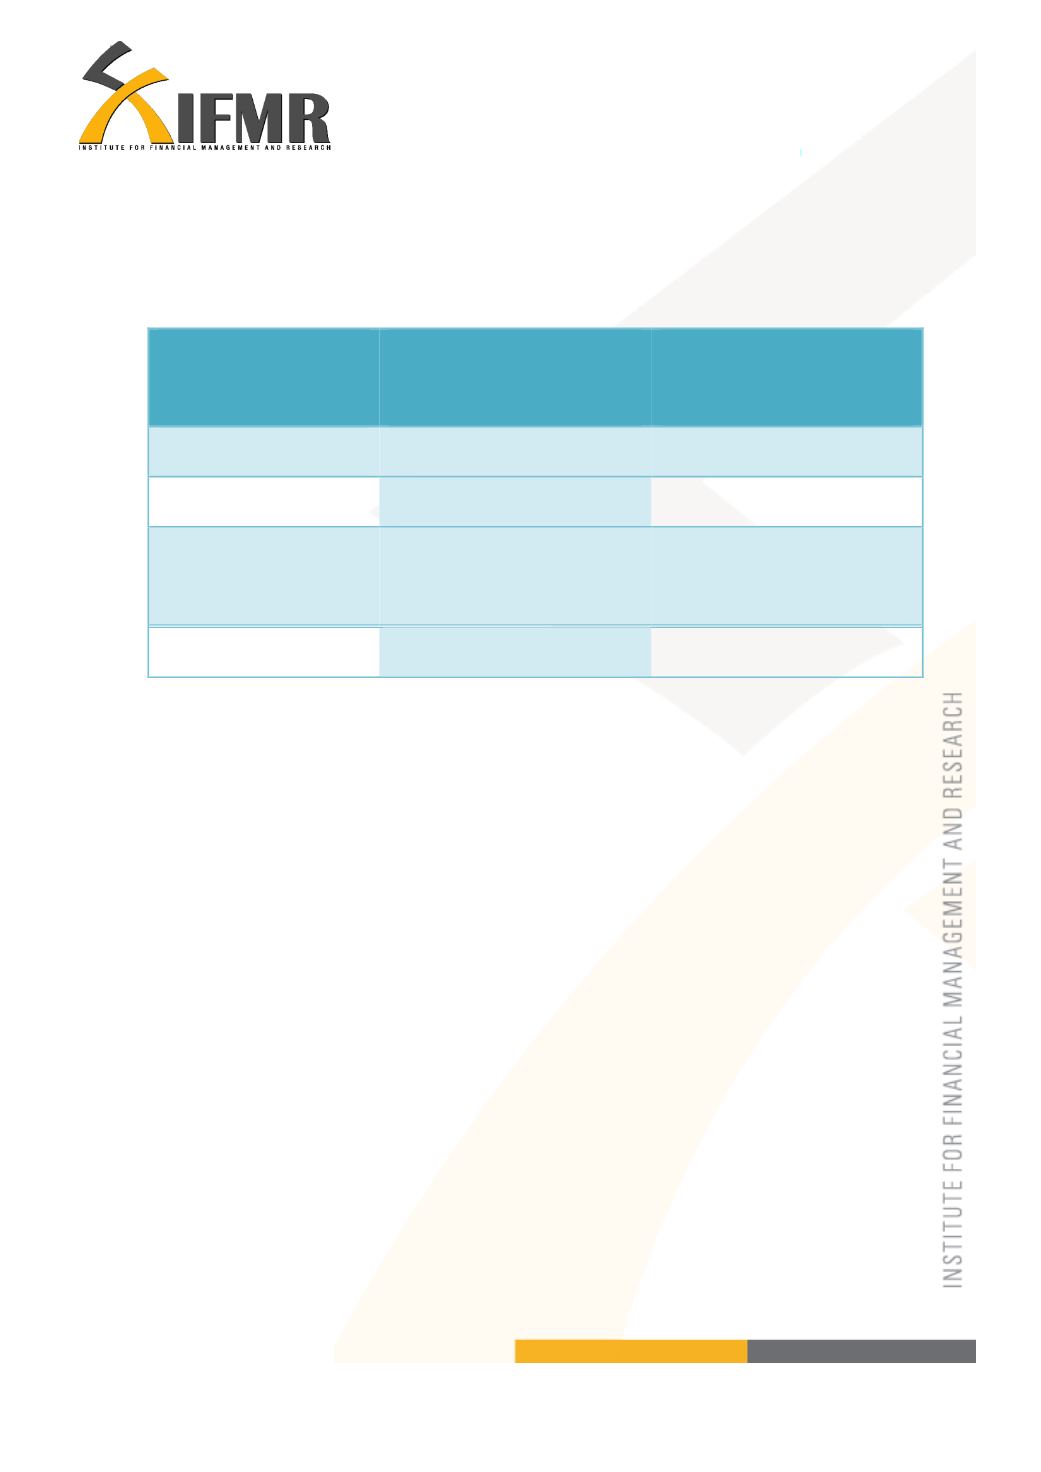
Table 6.6: NREGA income of the family in 2013 (and spending) Karnataka
Number of days worked (last
year)
Amount received as wages
(last year)
Average
85
14,475
Standard deviation
49.50
8,379.22
Number of
observations
2
2
Median
85
14,475
*in some of the households, more than one member has worked under the NREGA.
6.3
Why voluntary savings?
One question that we tried to answer is to find out how they benefit from voluntary
savings. Where did they use the cash which they have saved? We find that they gave
internal loans of amounts ranging from Rs. 1,000 to Rs. 50,000. As the SHG groups
became old the savings corpus gets higher and they are able to give bigger loans. We
find from Tables 6.7 and 6.8 that members use their savings for giving internal loans.
They also divide the interest collected from these loans once a year or once in two years.
Most groups followed the guidelines of the NGO (Non-Government Organization) that
has formulated the SHG to determine the interest rate they charged. It varied from 12-24
%.


