i nc lu s i ve f i nanc e i nd i a re port 2014
8
F
IGURE
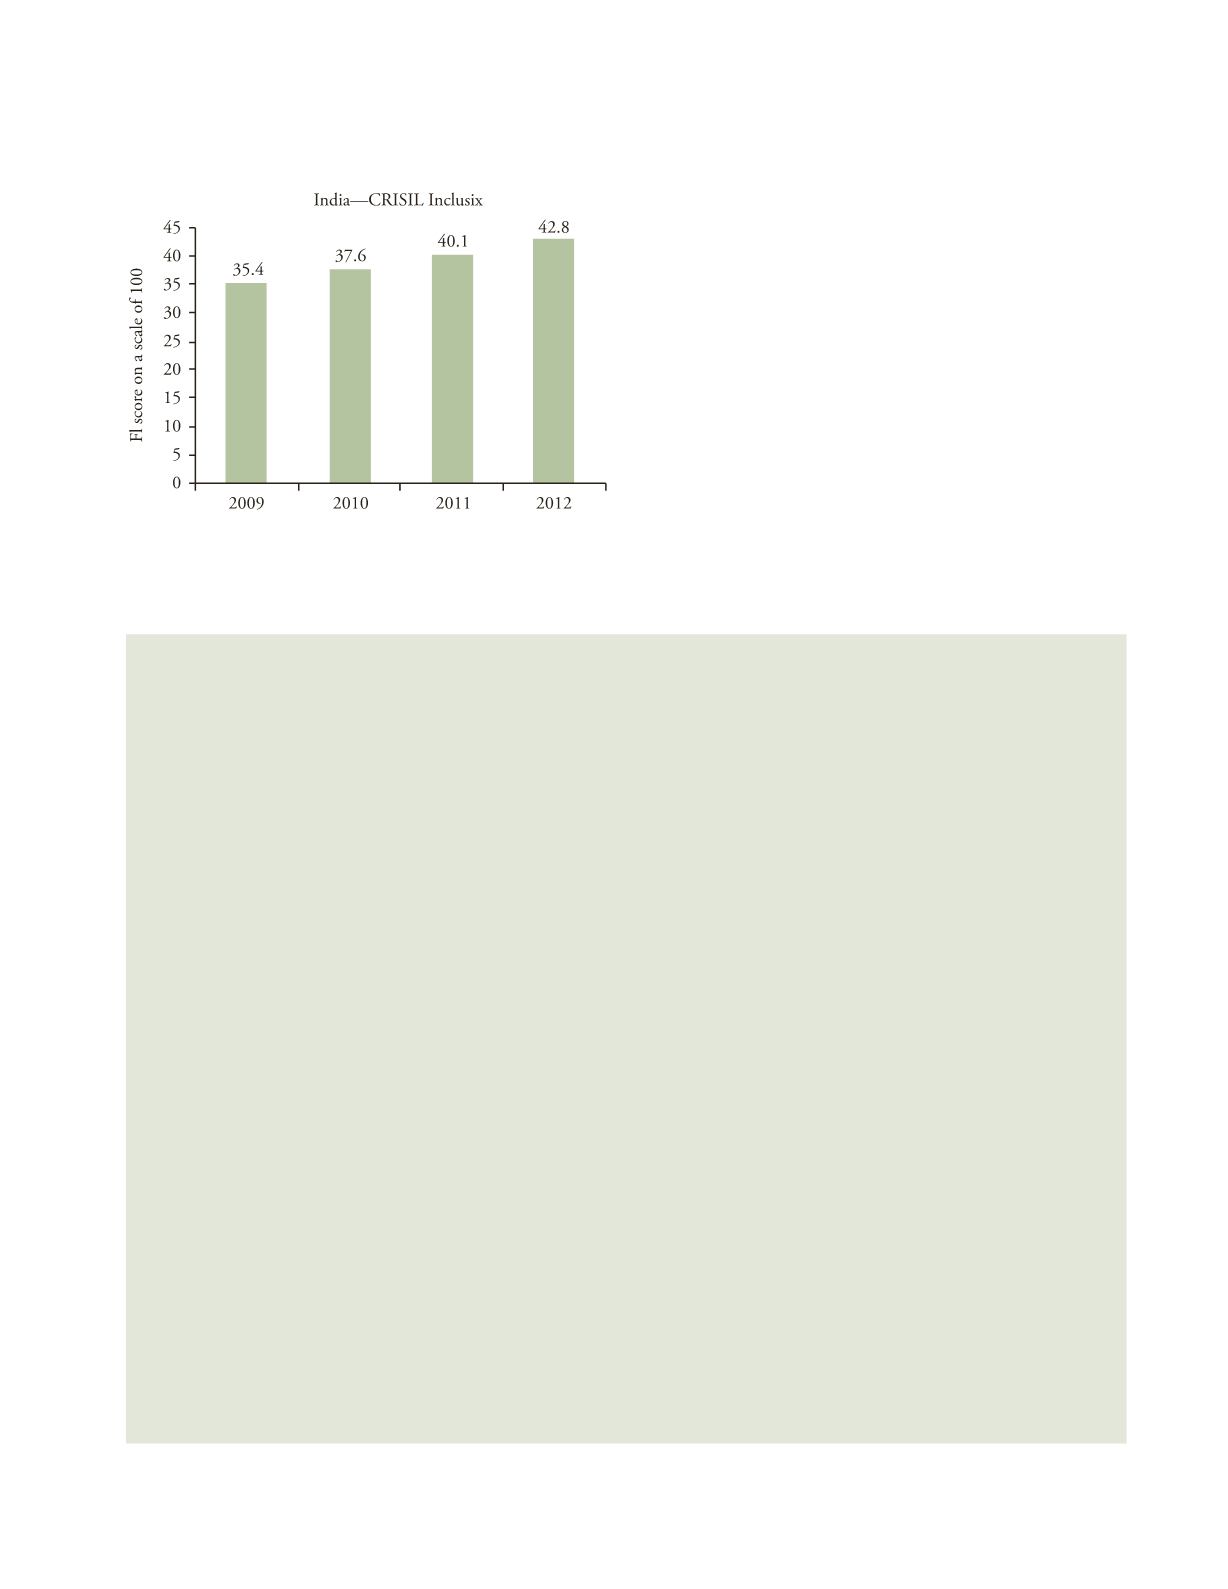
1.3
Financial Inclusion Score of India: CRISIL Inclusix
Source
: CRISIL (2013).
B
OX
1.1
Inclusix Survey: Key Findings
• The Inclusix experienced steady growth rate from 35.4 in 2009, 37.6 in 2010, and 40.1 in 2011 and reached 42.8 in the year
2012.
• The current Inclusix score of 42.8 out of 100 indicates under penetration of formal banking in the country.
• At the regional level, all the regions experienced growth in Inclusix score with western region scoring 40.9, northern 39.5,
north-eastern 30.9 and eastern 30.8 during the year 2012.
• Southern region with a financial Inclusix of 66.1 has experienced the maximum growth rate and remained the leader in all the
three dimensions of credit, branch and deposit penetration.
• 58% of the incremental credit accounts were opened in the south.
• 587 out of 638 districts reported an improvement in terms of financial inclusion in year 2012 against 618 out of 632 districts
in the year 2011.
• The average improvement in the Inclusix score of the bottom 50 districts was 1.6 compared with 4.3 for the top 50 districts and
an all-India average of 2.7.
• One out of every two Indians has a savings account and only one in seven has access to bank loan—showing low credit
penetration.
• Similar to 2011, the number of saving accounts (703 million) remains nearly four times the number of loan accounts (183
million) in the year 2012 as well.
• The number of savings bank accounts rose by 12.6% in the year 2012 indicating that more numbers of people are being touched
by formal financial system.
• India experienced 11.1% growth in agriculture credit accounts in 2012 over 2011.
• The top five states in terms of financial Inclusix are Puducherry, Chandigarh, Kerala, Delhi and Goa.
• The number of bank branches in the bottom 100 districts has increased by 6% which is higher than the national growth rate of
5.6%.
• There are 7.5 bank branches per lakh of population on an average. However, the bottom 50 districts have only 3.5 bank
branches per lakh of population.
• Year on increase in credit penetration is 8.3%.
• Wide disparities exist across India and within states in terms of access to financial services.
• India’s six largest cities have 10% of the country’s bank branches while eight districts in the North East have just 2 or less than
2 bank branches each.
• Similar to 2011, bottom 50 districts continue to have just 2% of the country’s bank branches.
Source
: CRISIL (2014).
non-banking financial companies (NBFCs) and MFIs,
with over 10,000 branches largely in the rural areas, is
not included. However, they cannot be ignored as their
client base almost entirely comprises people unserved or
under-served by the formal banking network. (See Box
1.1 for key findings of the survey.)
The top and bottom states in financial inclusion for
2012 as per CRISIL Inclusix are given in Table 1.3. The
Inclusix usefully captures elements of the fast-changing
financial inclusion landscape, though it excludes coop-
eratives and other important financial service providers
operating outside the banking system. Observers also feel
that it would be more useful if frequency of transactions
in savings bank accounts—and thereby the extent of in-
operative, defunct and inoperative accounts—could also


