428
business expenditure (from 63.8 per cent in 1981 to 52.5 per cent in 2002)
and within it, that of capital expenditure (from 45.3 per cent to 34.3 per cent)
that stand out. The increase in non-farm business expenditure for capital or
current expenditures has not compensated for the decline in farm business
expenditure.
Interestingly, even the non-farm business expenditure of non-cultivator
households has fallen from 23.3 per cent in 1981 to 19.0 percent in 2002.
Non-farm households have always borrowed more than 50 per cent for pure
household expenditures.
Extent of Farm Households Facing Financial Exclusion
Table 13 has been constructed to portray the extent of financial exclusion
of the farm community by all credit agencies in different regions. About 68 per
cent of the excluded farmer households belong to the three underdeveloped
regions, with the central region accounting for 34.5 per cent, the eastern region
27.6 per cent, and the north-eastern region 6.1 per cent.
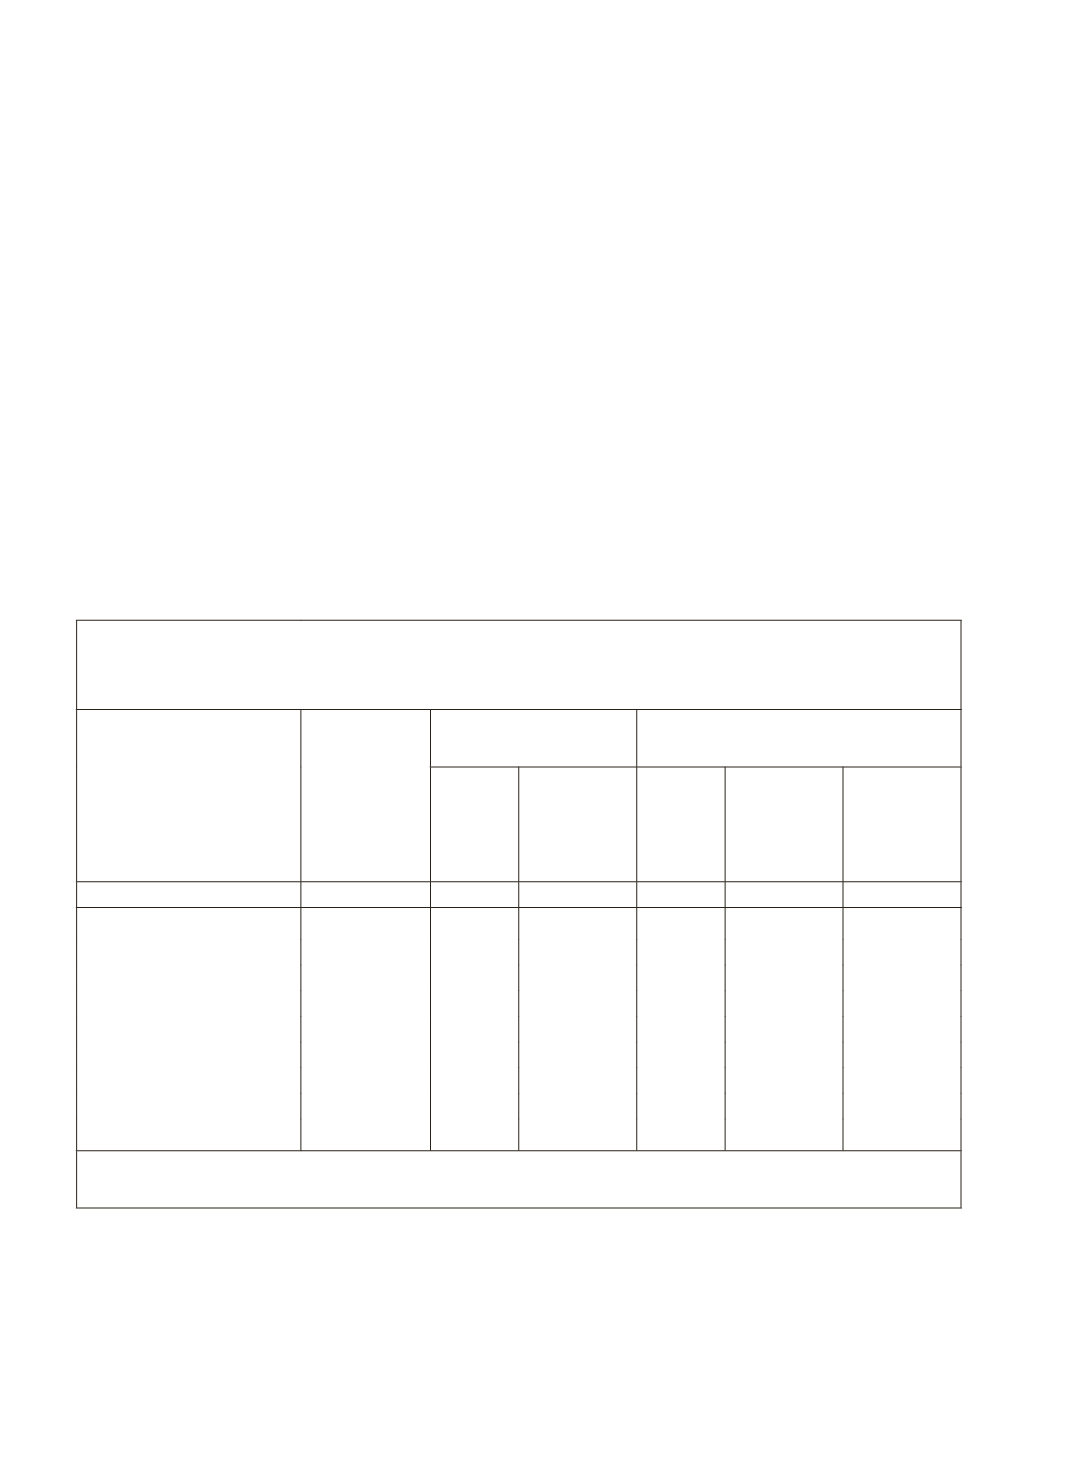
Table 13: Situation Assessment Survey of Farmers Estimated Number of
Farmer Households, Indebted Farmer Households and Farmer Household
Facing Financial Exclusion
State/Region-wise
Number of
Farmer
Households
(' 00 )
Number of Indebted
Farmer Households
Number of Farmer Houseeholds
Facing Financial Exclusion
Number
(' 00 )
Percentage
to Total
Farmer hhs
Number
(' 00 )
Percentage
to Total
Farmer hhs
Percentage
to Total
Farmer hhs
Facing
Exclusion
1
2
3
4
5
6
7
Northern Region
109460 56260
51.4 53200
48.6
11.6
North-Eastern Region
34874 6870
19.7 28004
80.3
6.1
Eastern Region
211140 84396
40.0 126744
60.0
27.6
Bihar
70804 23383
33.0 47421
67.0
10.3
West Bengal
69226 34696
50.1 34530
49.9
7.5
Central Region
271341 113045
41.7 158296
58.3
34.5
Western Region
103662 55742
53.8 47920
46.2
10.4
Southern Region
161578 117470
72.7 44108
27.3
9.6
All-India
893504 434242
48.6 458632
51.3
100.0
Note:
Worked out from Statement 2 of Situation Assessment Survey of Farmers : Indebtedness of Farmers.
NSSO Report No.498 (59/33/1).
On the other hand, the three relatively advanced regions have about 10
per cent each of the excluded farm households (Table 13). When we look at the
incidence of exclusion under different categories of the farm community, it is
found that the highest incidence of exclusion has occurred in the underabanked


