421
(ii)
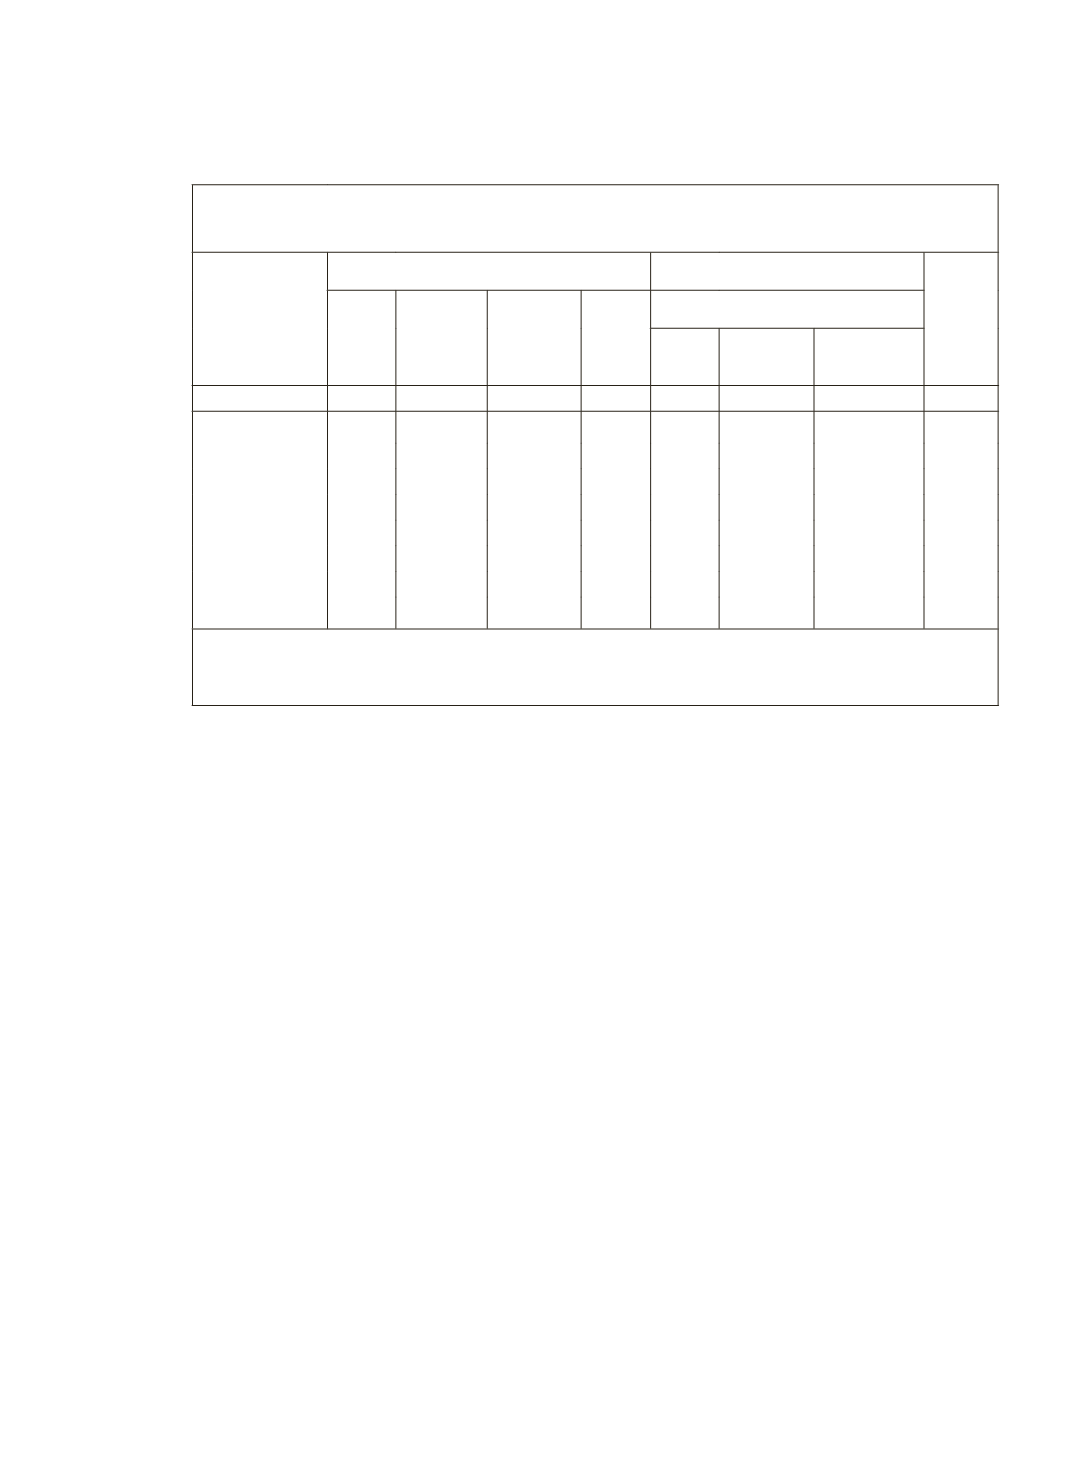
Interestingly, the cooperative sector loans are relatively more evenly
distributed amongst the medium and large-size holdings than in the
case of banks (Table 4).
Table 4: Per cent distribution of outstanding loans (in
`
) by source of
loans for each size class of land possessed by farmer households
Size class
of land
possessed
(in hectare)
Institutional Agencies
Non-Institutional Agencies All
Total Govern-
ment
Co-op
Society
Bank
Total of which:
Money
Lender*
Relatives
& friends
1
2
3
4
5
6
7
8
9
< 0.01
22.6
1.9
5.3 15.4 77.4
47.3
23.1 100.0
0.01-0.40
43.3
4.0
14.5 24.8 56.7
31.8
14.9 100.0
0.40-1.00
52.8
3.8
17.0 32.0 47.2
30.8
9.1 100.0
1.01-2.00
57.6
1.7
20.5 35.4 42.4
25.9
8.8 100.0
2.01-4.00
65.1
1.5
22.6 41.0 34.9
23.4
5.1 100.0
4.01-10.00
68.8
1.3
23.0 44.5 31.2
16.7
5.6 100.0
10.00+
67.6
1.7
23.2 42.7 32.4
17.2
4 100.0
All Sizes
57.7
2.5
19.6 35.6 42.3
25.7
8.5 100.0
‘ * ‘ Includes both professional and agriculturist money lenders
Source:
NSSO(2005), Indebtedness of Farmer Households, NSS 59
th
Round (Jan-Dec 2003),
Report No. 498(59/33/1)
But, marginal farmers have received lower share even from cooperatives.
Probably because of directed credit arrangements, the commercial banks have
provided a relatively higher share for the marginal farmers; there have been
directions from the government to provide a higher share of credit for small
and marginal farmers.
State-Wise
There are significant inter-state and inter-regional disparities in the
incidence of indebtedness. The southern region enjoys the highest incidence
(31 to 42 per cent) and the eastern region generally the lowest (26 to 8 per
cent). The shares of institutional agencies are generally high in the south
except Andhra Pradesh which, amongst all states, faces the highest incidence
of incidence to the non-institutional agencies (33 per cent against Kerala’s 12
per cent). Even Maharashtra enjoys a better institutional share, 23 per cent as
against 7 per cent from non-institutional agencies.
By Asset Classes
(i)
The inequality in the distribution of institutional loans appears much
more severe when size-wise distribution of asset holdings are attempted.


