426
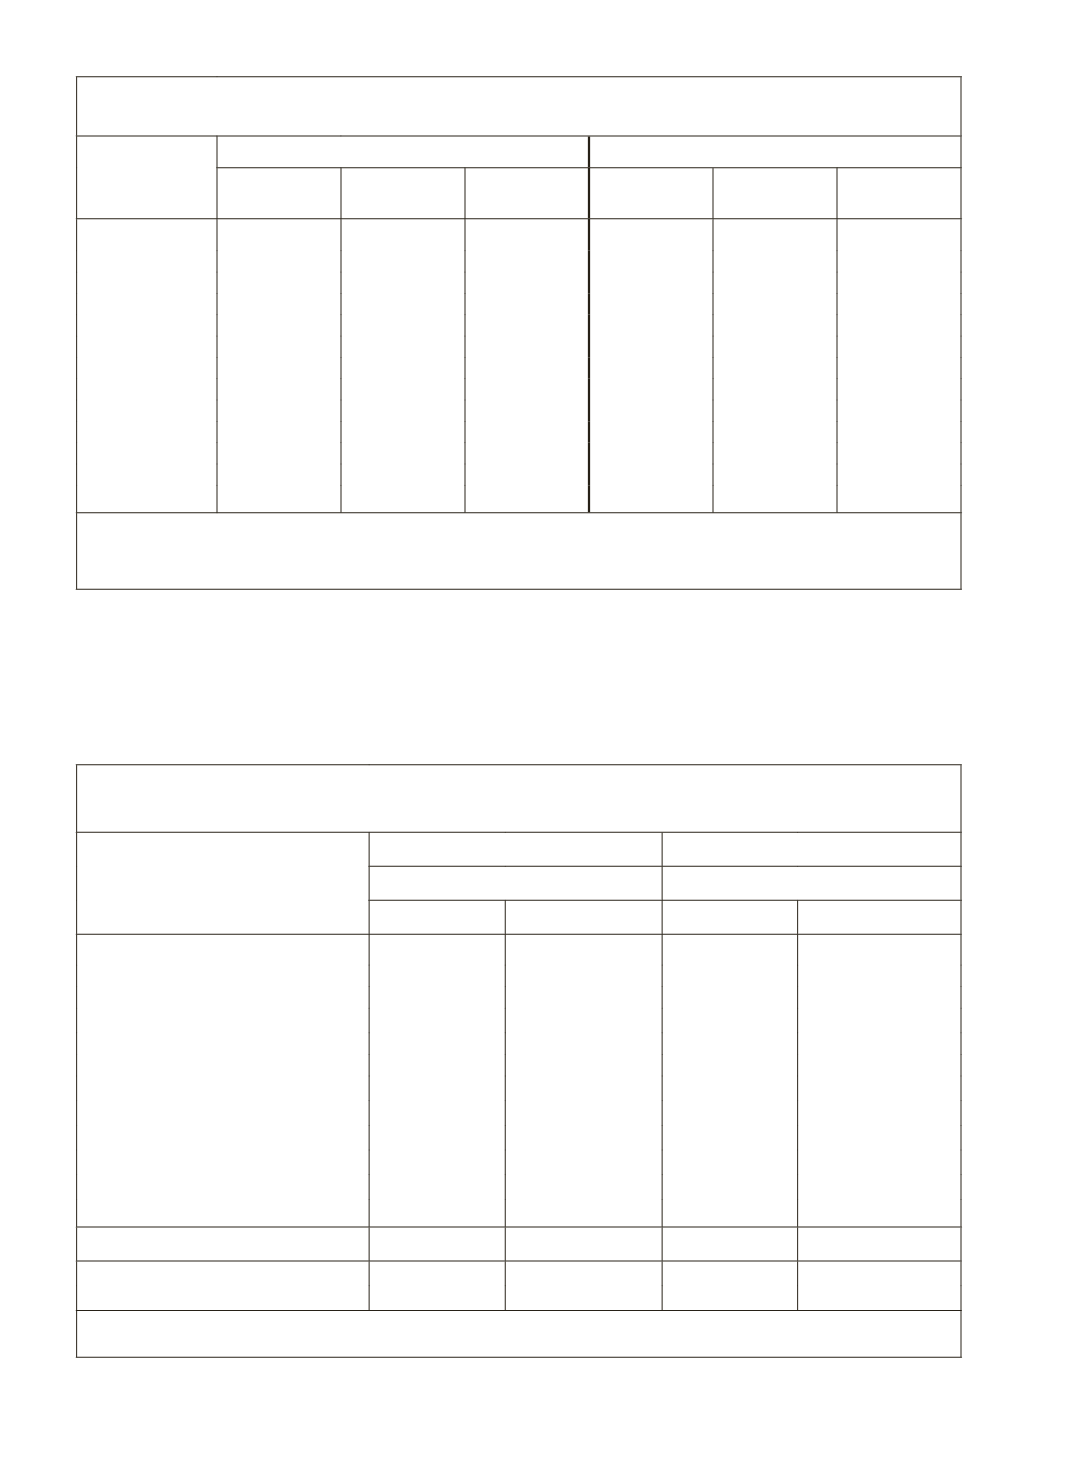
Table 10: Percentage Distribution of Cash debt by Occupational Category
and Credit Agencies as on 30-6-2002
Rate of
Interest Class
(%)
Institutional Agencies Rural Areas
Non-Institutional Agencies
Cultivator
Non-
Cultivator
All Rural
Household
Cultivator
Non-
Cultivator
All Rural
Household
nil
0.5
2.3
0.9
17.4
20.4
18.4
less than 6
1.8
2.7
2
2.3
2.5
2.4
6-10
3
6.9
3.8
0.3
1.5
0.7
0-10
4.8
9.6
5.8
2.6
4
3.1
10-12
7.4
14
8.8
0.6
0.2
0.5
12-15
50
39.8
47.8
1.6
0.8
1.3
15-20
34.8
32.5
34.3
2.7
3
2.8
10-20
92.2
86.3
90.9
4.9
4
4.6
20-25
1.4
1.2
1.4
36.2
27.5
33.3
25-30
0
0
0
0.3
0.1
0.3
30 % above
0.3
0.3
0.3
38.2
43.9
40.1
20 % above
1.7
1.5
1.7
74.7
71.5
73.9
All
100
100
100
100
100
100
Note :
All included not reported
Source :
Source: NSSO (2005), Household Indebtedness in India as on 30.6.2002 59th Survey, Report
No. 501(59/18.2/2)
Debt by Purpose
Table 11 portrays the purpose-wise distribution of indebtedness
amongst rural households by occupational categories, i.e., by cultivator and
non-cultivator categories.
Table 11: Percentage of Indebted Households (P) and Percentage of Dues
Outstanding as on 30-6-2002 by Purpose of Loans Among Rural Households
Purpose of Loans
Cultivator
Non-Cultivator
Percentage of
Percentage of
Households
Cash dues
Households
Cash dues
Farm-Business
15.4
52.5
2.5
9.3
Capital Expenditure
8.2
34.3
1.6
6.3
Current Expenditure
7.9
18.2
1.0
3.0
Non-Farm Business
2.4
9.4
3.6
19.0
Capital Expenditure
1.8
7.4
2.5
14.2
Current Expenditure
0.6
2.0
1.2
4.8
Household Expenditure
12.1
27.7
14.2
55.0
Repayment of Debt
0.4
1.5
0.4
1.3
Expenditure on Litigation
0.1
0.3
0.1
0.2
Financial Investment
0.1
0.6
0.1
1.0
Other Purposes
2.3
8.0
2.3
13.9
All (non-business)
14.6
38.1
16.8
71.4
Expenditure in Household
not reported
0.0
0.0
0.0
0.3
All
29.7
100.0
21.8
100.0
Source:
NSSO(2005) Household Indebtedness in India as on 30.6.2002, 59th Round, Report No.501
(59/18.2/2).


