420
cooperative societies and banks and not under commercial banks. It
reflects the inefficiencies that have set in the functioning of cooperatives.
By Land Size
(i)
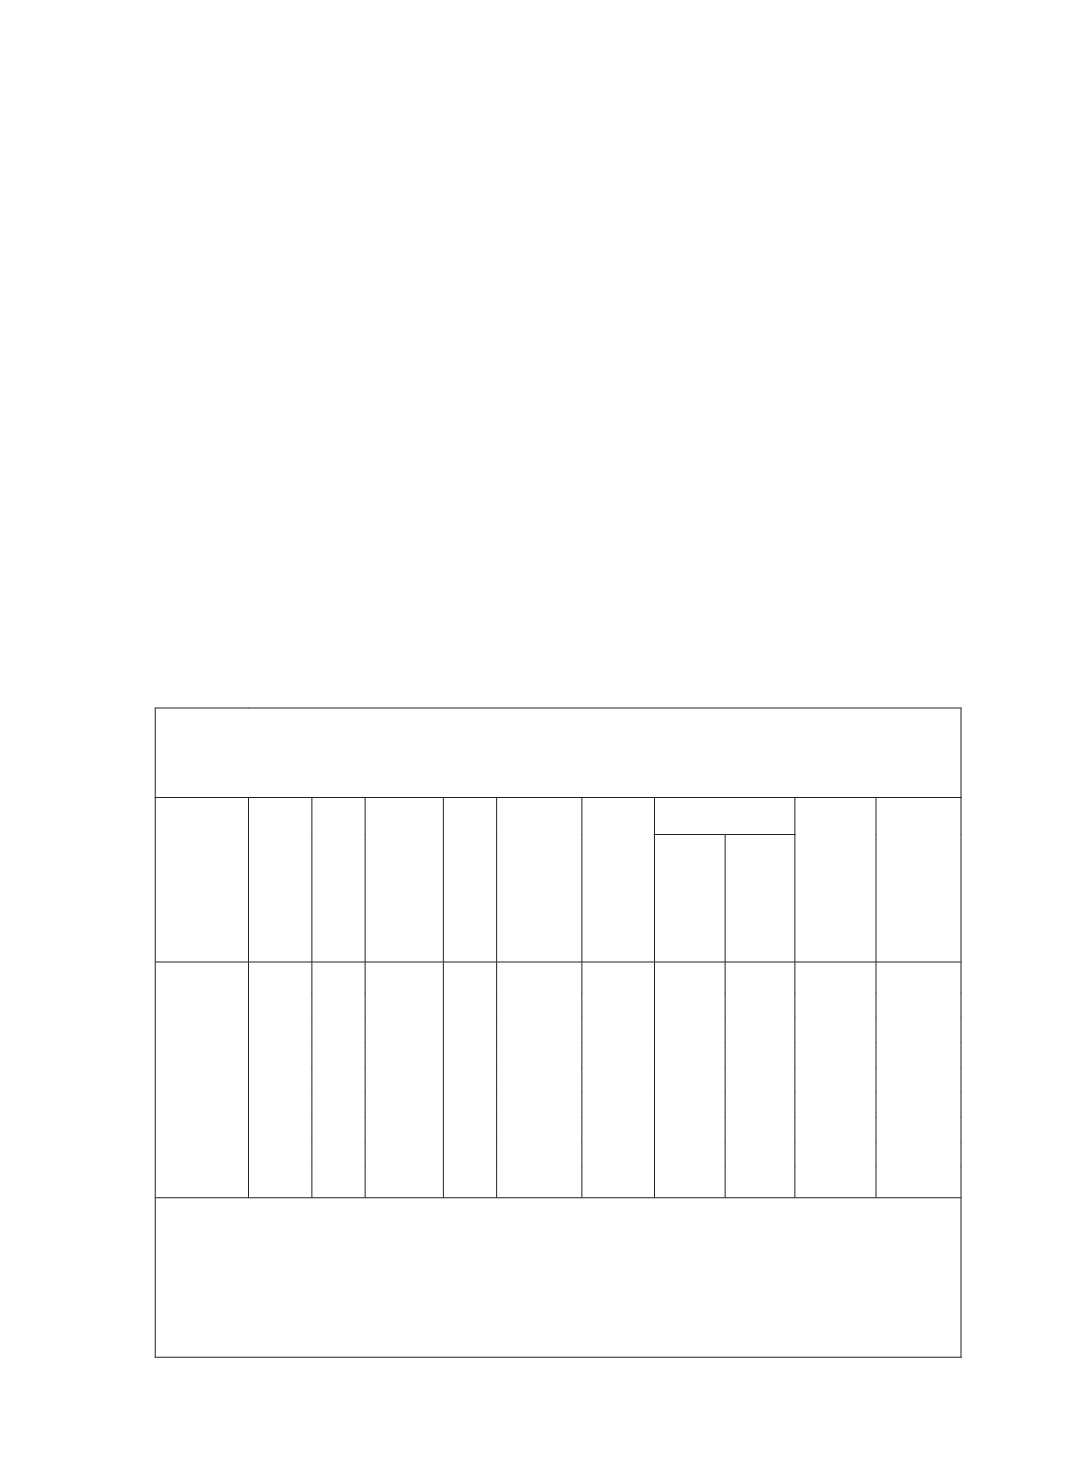
In the distribution of farmer households by land possessed, the
prevalence of indebtedness increases with the size of landholdings.
About 84 per cent of farmer households or 80 per cent of indebted
households belong to up to 2 hectares of land possessed. But, what
is significant is that there is increase in indebtedness with the size of
holdings; more significantly, the share of institutional agencies in total
loans tends to rise much more progressively. In the lowest size groups up
to 0.40 hectare (marginal farmers), the shares of institutional agencies
have ranged from 23 to 43 per cent, whereas in the large size groups
of above 2 hectares, the corresponding shares have been 65 to 69 per
cent. Contrariwise, in the case of marginal farmers, the shares of non-
institutional agencies have been 57 to 77 per cent, whereas the shares
of large-size groups in indebtedness to these agencies have been 31 to
35 per cent (Table 3).
Table 3: Estimated Number of Total and Indebted Farmer Households
in Each Size Class of Land Possessed and Estimates of Debt
Outstanding for 2003
Size Class
of Land
Possessed
in ha.
Number
of
Farmer
House-
holds
In
million
Per
cent
to
Total
Number of
Indebted
Farmer
House-
holds in
million
Per
cent
to
Total
Prevalence
Rate of
Indebted-
ness
(percent-
age)
Amount
Outstand-
ing
(in
`
) per
Farmer
House-
holds
Loan from
Amount
Out-
standing
(
`
crore)
of which:
Insti-
tutional
Agencies
(
`
crore)
Institu-
tional
Agencies
(per
cent)
Non
Institu-
tional
Agencies
(per
cent)
< 0.01
1.26 1.4
0.57 1.3
45.3
6121
22.6
77.4 770.88
174.22
0.01 – 0.40 29.29 32.8
13.01 30
44.4
6545
43.3
56.7 19168.15 8299.81
0.41 – 1.00 28.36 31.7
12.92 29.8
45.6
8623
52.8
47.2 24455.69 12912.60
1.01 – 2.00 16.06 18
8.19 18.9
51 13762
57.6
42.3 22101.77 12730.62
up to 2.00 74.97 83.90 34.70 79.90
46.30 8870.00 51.30 49.70 66496.49 34117.25*
2.01 – 4.00
9.35 10.5
5.44 12.5
58.2 23456
65.1
35.0 21932.30 14277.93
4.01 – 10.00 4.26 4.8
2.77 6.4
65.1 42532
68.8
31.1 18110.55 12460.06
10.00 +
0.77 0.9
0.51 1.2
66.4 76232
67.6
32.4 5906.46 3992.76
All Sizes
89.35 100
43.42 100
48.6 12585
57.7
42.4 112447.48 64882.20
Notes:
(i) Amount of outstanding loan: For each loan, the amount outstanding on the date of survey was the sum of
principal outstanding and the interest payable as on the date of survey. In case of kind loans, the amount of the
liability was evaluated at the current market prices prevailing in the locality.
‘*’ Roughly increasing it by 20 per cent per annum for the next three years, the outstanding works out to about
`
60,00
crores in 2006.
Source:
NSSO(2005), Indebtedness of Farmer Households, Situation Assessment Survey of Farmers, NSS 59
th
Round
(January-December 2003), Report No. 498(59/33/1)


