147
or from
`
22,022 crore to
`
67,361 crore in loans outstanding or by 206% (see
also Charts 13a and 13b).
As we point out in a subsequent paragraph, the above turns out to be a
major source of uncertainty in regard to the cooperative sector data.
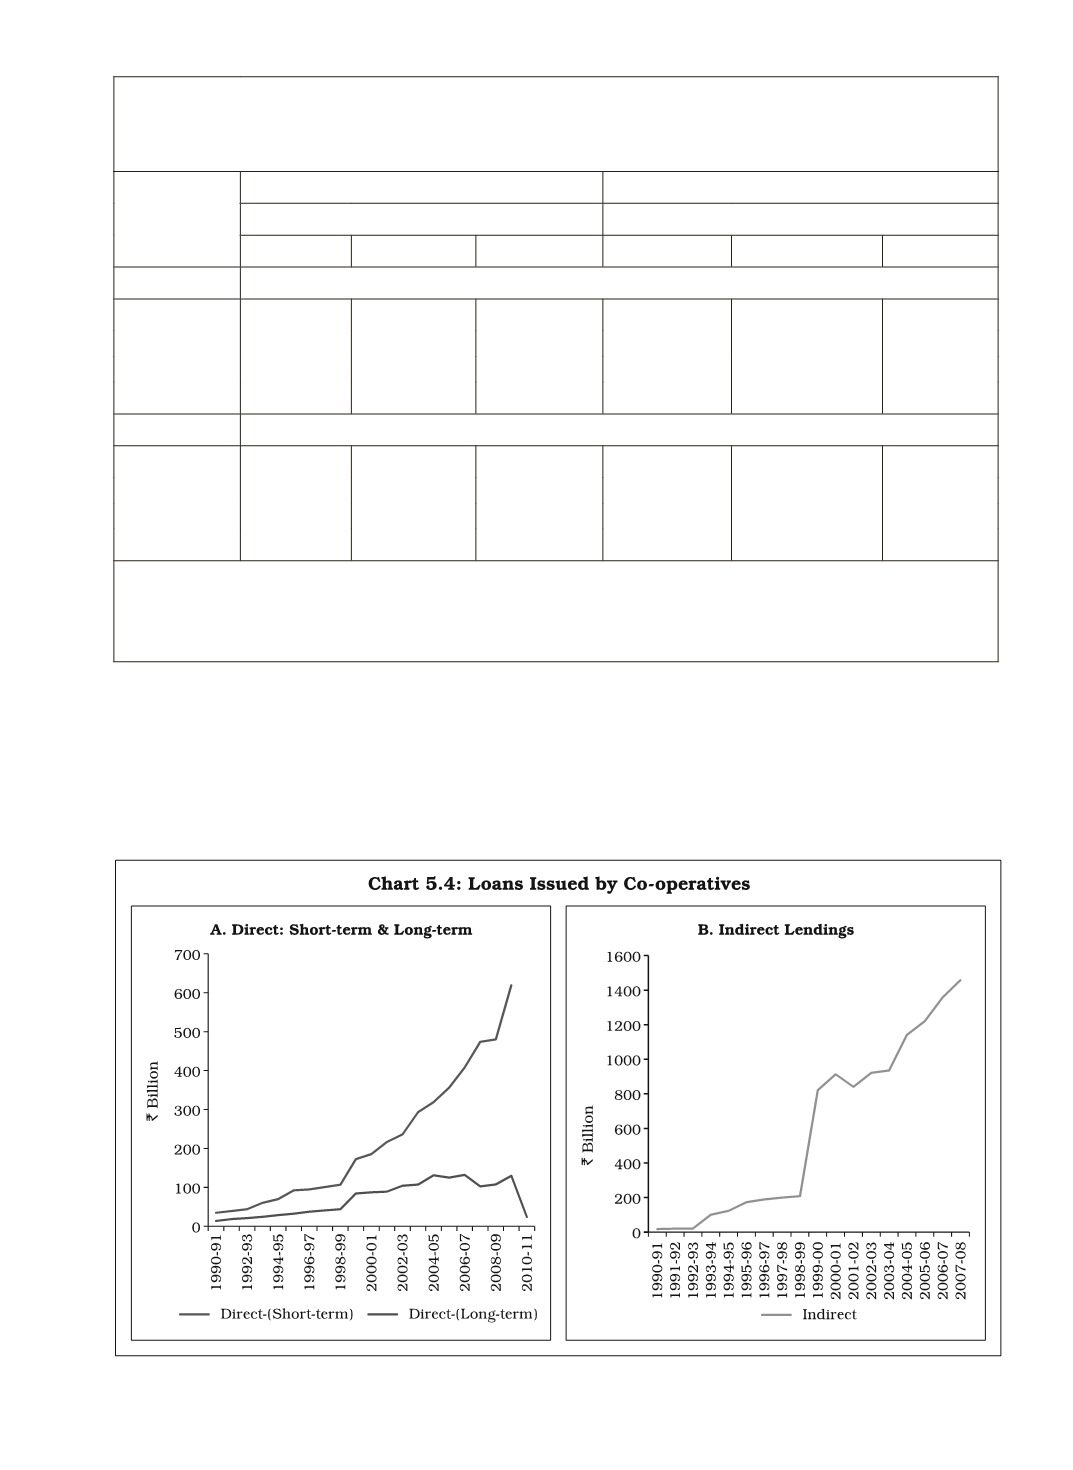
Table 5.5: Impact of the Inclusion of SCARDBs and PCARDBs
Data from 1999-2000 in Respect of Cooperatives
(Rupees, Crore)
Year
Loans Issued
Including
Loans issued
Excluding
Those of SCARDBs & PCARDBs
Those of SCARDBs & PCARDBs
Direct
Indirect
Total
Direct
Indirect
Total
Part A: Loans Issued in Respect of Cooperatives
1998-99
15,099
20,818
35,917
15,099
20,818
35,917
1999-2000
@
25,678
82,186
107,864
16,115
21,857
37,972
2000-2001
@
27,295
91,337
118,638
17,235
22,952
40,187
2001-2002
@
30,569
84,092
114,661
18,202
24,108
42,310
Part B: Loans Outstanding in Respect of Cooperatives
1998-99
22,199
22,022
44,221
22,199
22,022
44,221
1999-2000 41,950
@
67,361
109,311
23,175
22,022
45,197
2000-2001 46,135
@
79,567
125,702
24,237
24,714
48,951
2001-2002 52,110
@
89,092
141,202
25,321
27,634
52,955
@
Inclusion SCARDBs and PCARDBs data began to be reported in the RBI's annual publication
Handbook
of Statistics on the Indian Economy
in the year 2007-08, effective from
the year 1999-2000 (pp.113-114).
In the previous issue of the
Handbook (2006-07),
the above three year data were reported by covering only
PACs and not SCARDBs and PCARDBs (pp.113-114) as shown on the right side of the table.


