157
Assuring that all these belong to allied agricultural activities as they
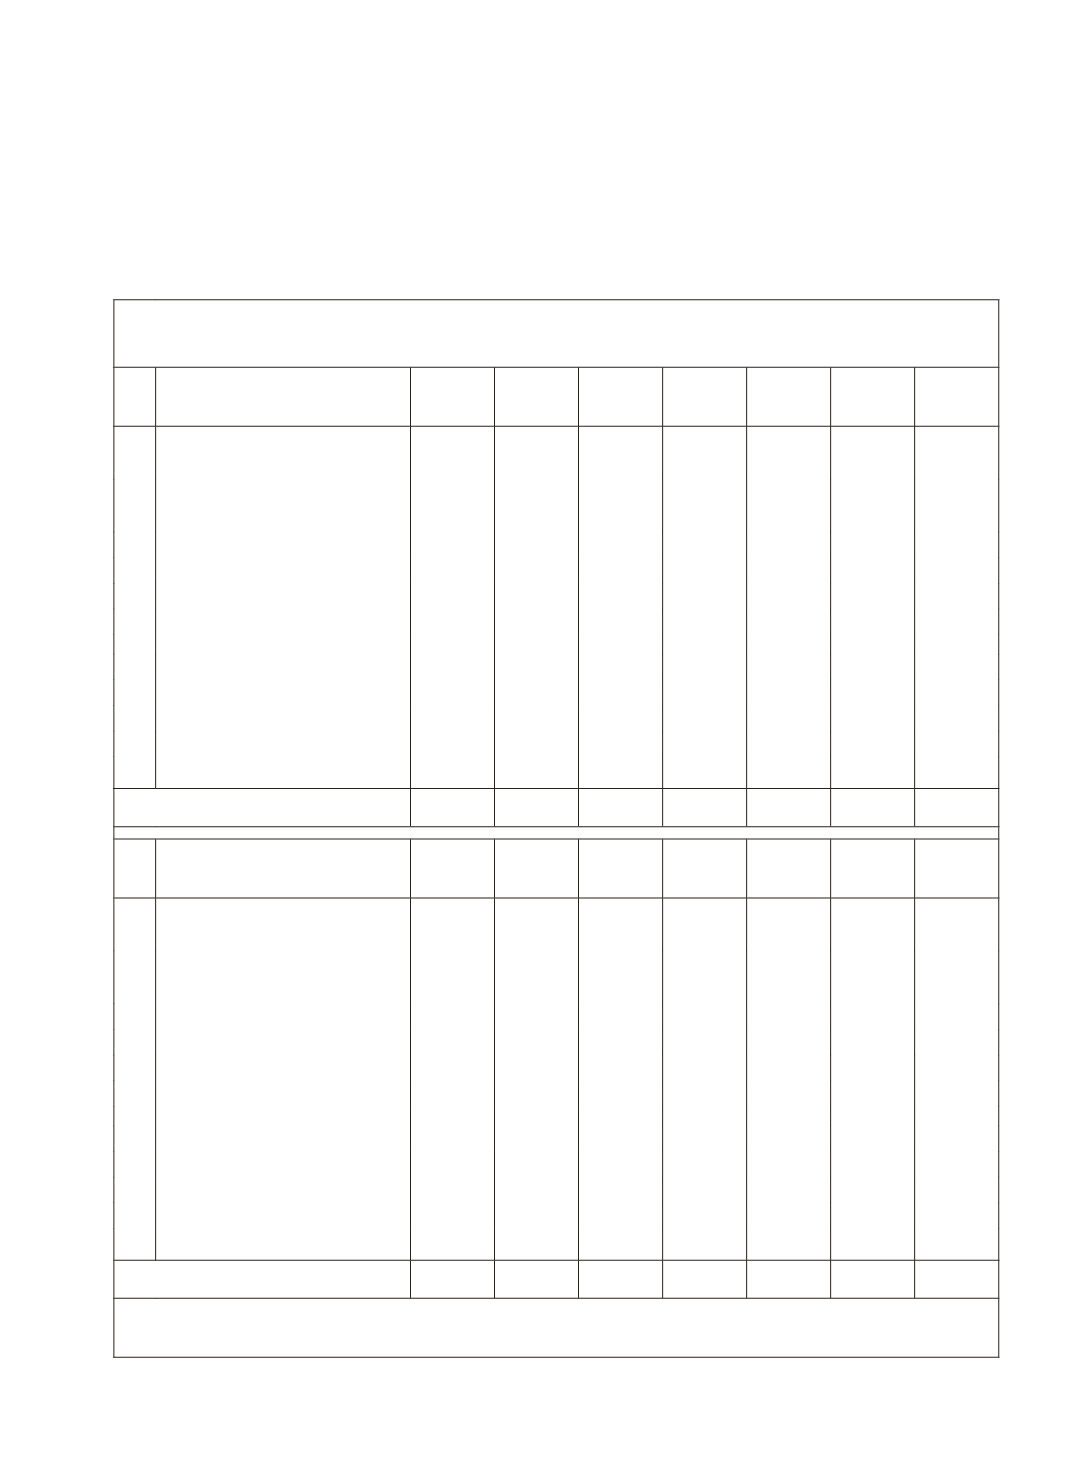
seem obvious, data presented in Table 5.11 reveal that insofar as term loans
are concerned, an overwhelming proportion of term loans under agriculture
goes to these allied activities. This ratio has gone up from 53.0% in 1997-98 to
77.2% in 2003-04, to 80.5% in 2004-05 and 84.3% in 2010-11. The balance of
the term loans, namely about 16% has gone in favour of physical investment in
Table 5.11: Sub-Sector-Wise Ground Level Credit Flow for Agriculture and
Allied Activities: With Details of Term Loans for Allied Activities
Sr.
No.
Sector/Sub-Sector
1997-98 1998-99 1999-00 2000-01 2001-02 2002-03 2003-04
I. Short-Term
(ST - Production Credit)
20,640 23,903 28,965 33,314 40,509 45,586 54,977
II. Term Loans
(MT & LT Investment Credit)
11,316 12,957 17,303 19,513 21,536 23,974 32,004
i. Minor Irrigation (MI)
1,584 1,790 2,346 1,821 1,845 1,976 2,730
ii. Land Development (LD)
173 217 319 290 307 393 579
iii. FarmMechanisation (FM)
3,566 3,936 3,889 4,125 3,847 3,600 3,986
Allied Activities (iv to viii)
5,993 7,014 10,749 13,277 15,537 18,005 24,709
(53.0)
(54.1)
(62.1)
(68.0)
(72.1)
(75.1)
(77.2)
iv Plantation & Horticulture
755 767 777 755 765 1,195 1,436
v Animal Husbandry
1763 1996 2119 2188 2221 2637 2928
vi Fisheries
338 448 405 318 508 539 1142
vii Hi-tech agriculture
1101 1339 1360 2088 2257 2268 4017
viii Others
2036 2464 6088 7929 9786 11366 15186
Total (I + II)
31,956 36,860 46,268 52,827 62,045 69,560 86,981
Sr.
No.
Sector/Sub-Sector
2004-05 2005-06 2006-07 2007-08 2008-09 2009-10 2010-11
I. Short-Term
(ST - Production Credit)
76,062 105,350 138,455 181,393 210,461 276,656 335,550
II. Term Loans
(MT & LT Investment Credit)
49,247 75,136 90,945 73,265 91,447 107,858 132,741
i. Minor Irrigation (MI)
4,186 8,663 8,566 2,840 3,180 5,197 4,363
ii. Land Development (LD)
840 1,749 2,285 2,553 2,887 3,669 3,615
iii. FarmMechanisation (FM)
4,555 9,695 10,113 8,303 8,334 10,211 12,800
Allied Activities (iv to viii)
39,666 55,029 69,981 59,569 77,046 88,781 111,963
(80.5)
(73.2)
(76.9)
(81.3)
(84.3)
(82.3)
(84.3)
iv Plantation & Horticulture 1,720 4,481 5,266 5,910 6,045 6,407 6,610
v Animal Husbandry
3097 7341 8045 9034 10398 10260 12773
vi Fisheries
1301 1019 1424 1248 1281 1854 1931
vii Hi-tech agriculture
6648 9737 21498 33325 41694 50797 82774
viii Others
26900 32451 33748 10052 17628 19463 7875
Total (I + II)
125,309 180,486 229,400 254,658 301,908 384,514 468,291
Note:
Figures within brackets are ratios of allied activities to total term loans.
Source:
NABARD Annual Report up to 2011-12.


