150
Steeper Decline in the Share of Cooperative
NABARD data on ground-level credit flow agency-wise show a much
steeper decline in the share of cooperatives after the latter half of the 1990s,
than that shown by the RBI’s
Handbook
series reviewed by us earlier. The
share cooperatives in this NABARD’s flow data had suddenly dropped from
61.8% in 1992-93 and 61.3% in 1993-94 to 50.2% in 1994-95 and steadily
fallen thereafter to as low a figure as 15.2% in 2008-09 and 17.2% in 2011-12.
In the RBI’s
Handbook
series, on the other hand, the share of cooperatives was
as high as 61.5% in 1999-2000 (as against 39.5% in the NABARD data) and
it fell to 37.1% in 2007-08 (as against 19% in the NABARD data).To dilate a
while on these differences, it is obvious that it is as a result of the changes in
the reporting arrangement under the special agricultural credit plans (SACPs)
for commercial banks since 1994-95 that the relative shares of cooperatives
and commercial banks underwent significant changes in these NABARD data
(as explained earlier).
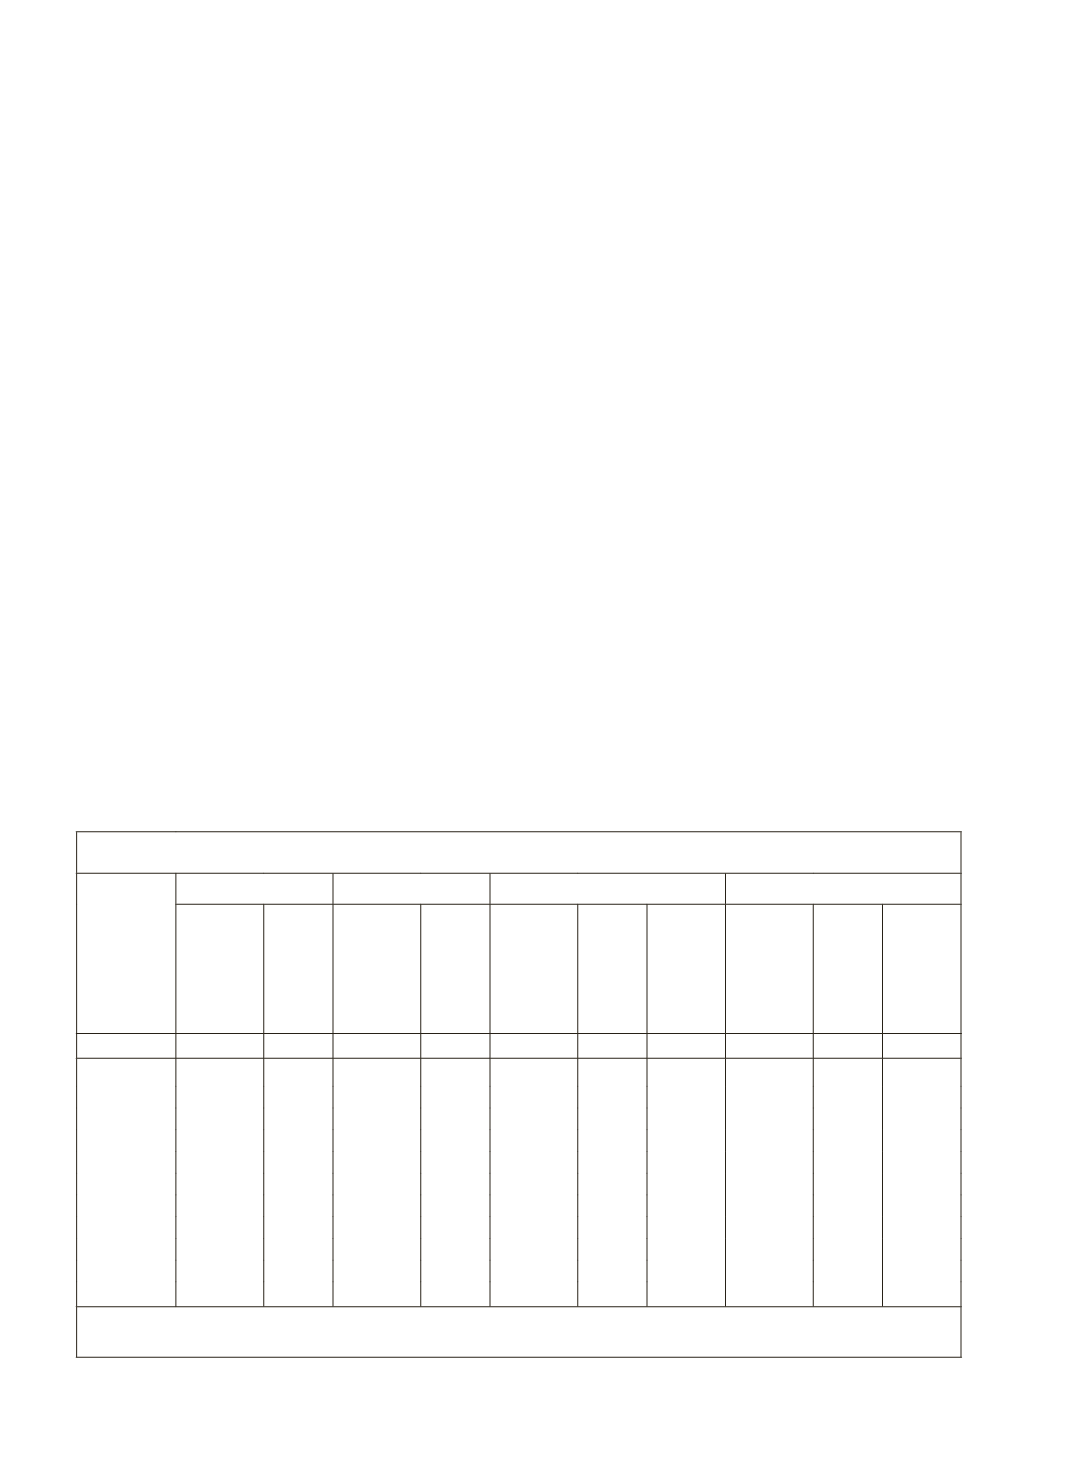
More than the relative shares, it is the absolute differences as between
the earlier
Handbook
series and the
SACP
series after 1994-95 that stand
out, particularly for commercial banks, as shown in columns (8) and (11)
in Table 5.7.
SACP
series began with a small difference over the
Handbook
series in 1995-96, but thereafter it steadily increased but rather steeply. Thus,
for commercial banks, the special reporting under SACP series has placed
Table 5 7: Differences in Data on Direct Finance for Agriculture: Loans Issued
Year April-
March
Cooperatives
RRBs
Commercial Banks
Total
Handbook
Series
SACP
Series
Handbook
Series
SACP
Series
Handbook
Series
SACP
Series
Percent-
age
Excess
of
SACP
Series
Handbook
Series
SACP
Series
Excess
of SACP
Series
(In
percent-
ages)
(1)
(2)
(3)
(4)
(5)
(6)
(7)
(8)
(9)
(10)
(11)
1994-95
9,876 9,406 1,083 1,083 7,408 8,255
18,773 18,744
1995-96
12,483 10,479 1,381 1,381 9,274 10,172
9.7 23,692 22,032 -7.0
1996-97
13,254 11,944 1,748 1,684 10,675 12,783 19.7 26,345 26,414
0.3
1997-98
14,159 13,975 2,103 2,040 11,537 15,831 37.2 28,656 31,956 11.5
1998-99
15,099 15,870 2,515 2,460 14,663 18,443 25.8 32,697 36,860 12.7
1999-2000 16,115 18,260 2,985 3,172 16,350 24,773 51.5 35,971 46,268 28.6
2000-01
17235 20,718 3,966 4,220 16,440 27,807 69.1 38,127 52,827 38.6
2001-02
18,202 23,524 4,546 4,854 18638 33,587 80.2 41,828 62,045 48.3
2002-03
- 23,636 5,879 6,070 25,256 39,774 57.5
-
-
-
2003-04
- 26,875 7,175 7,581 36,203 52,441 44.8
-
-
-
2004-05
- 31,231 11,927 12,404 48,367 81,481 68.5
-
-
-
SACP Series represent Special Agricultural Credit Plans of Scheduled Commercial Banks
For Sources, see Annexure I and Table 5.6.


