154
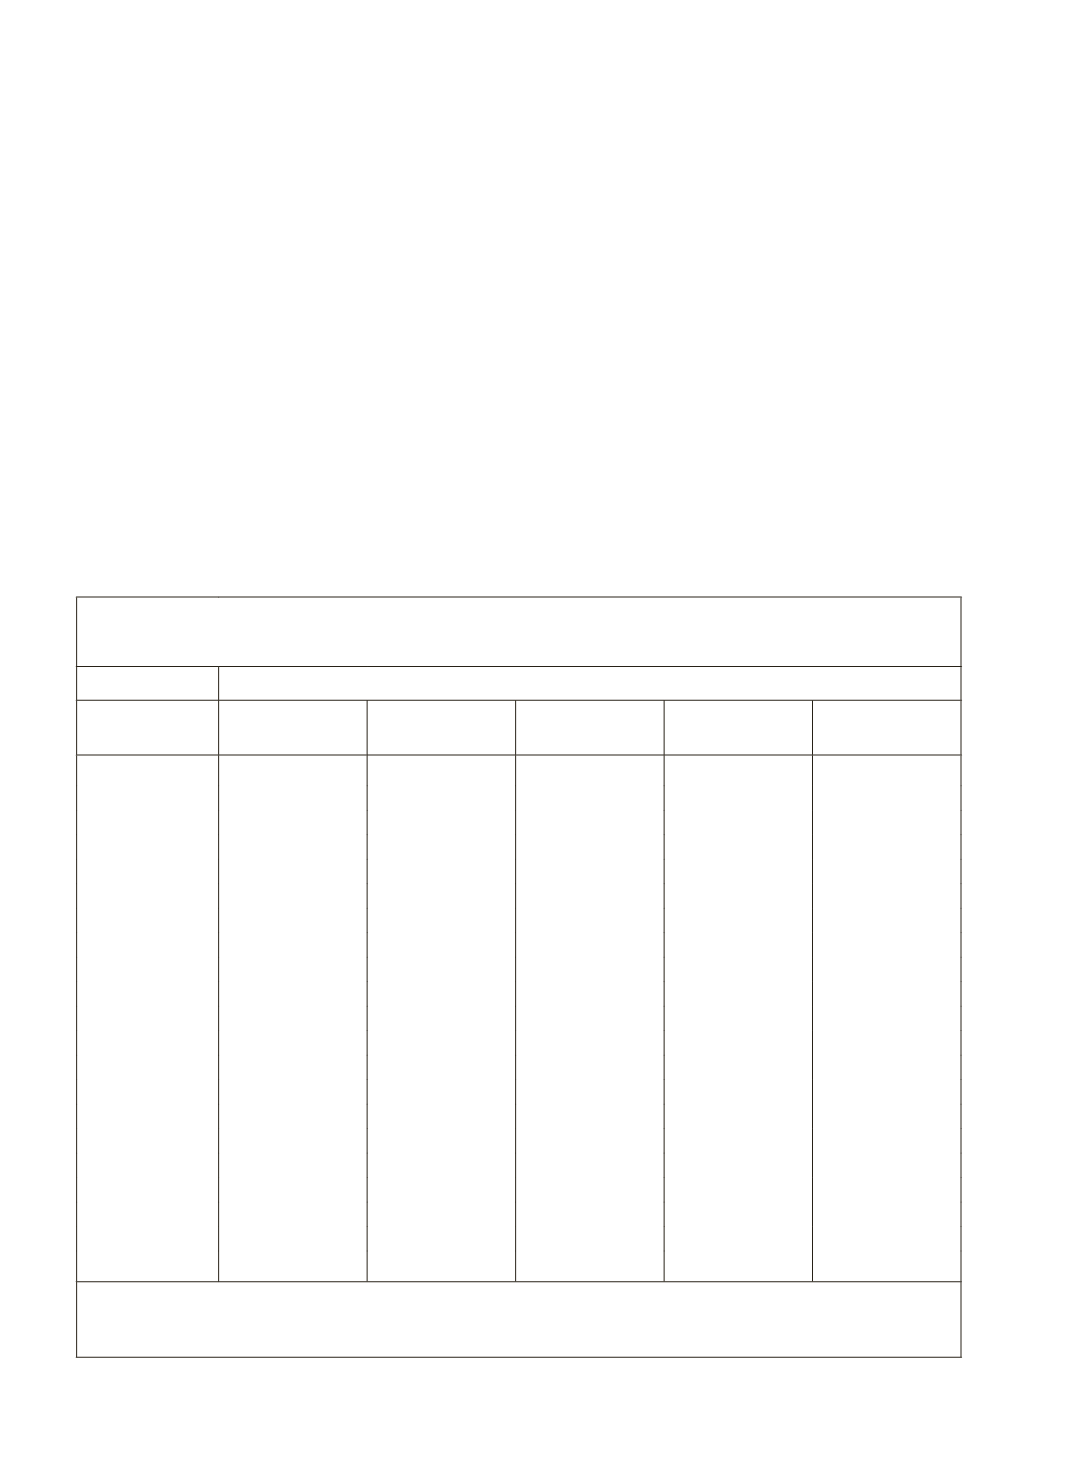
As may be seen in Table 5.9, this was the situation obtaining until the
year 2002-03 or thereabout. The share of term loans in total ground-level
disbursements slightly receded from the peak of 37.4% in 1999-00 to 34.5 % on
2002-03. By and large, the features described by the Investment Credit Expert
Group had remained true, that the ratio of 65:35 remained for a number of
years as between crop loans and investment credit and that the growth rates
between the two had similarly remained more or less the same. But, after 2003-
04, the share of term loans have begun to look up in the official data for some
years. The share of term loans issued rose from 36.8% in 2003-04 to 41.6%
in 2005-06 or 39.6 in 2006-07. However, as the story has unfolded earlier,
these official data contain a flaw, which is that the figures include indirect
lendings including those of bank deposits kept under RIDF. As we explain in a
later paragraph, such indirect lendings are covered under term loans. Despite,
that, the share of term loans has declined from 39.6% in 2006-07 to 22.5% in
2011-12, the latest available data (Table 5.9).
Table 5.9: Agency-wise and Sub-sector-wise Ground Level Credit Flow for
Agriculture and Allied Activities
NABARD’s Official Series
Year
Crop Loans
(
`
crore)
Per cent
to Total
Term Loans
(
`
crore)
Per cent
to Total
Total
(
`
crore)
1991-92
11202
1992-93
10091
66.5
5078
33.5
15169
1993-94
11271
68.3
5223
31.7
16494
1994-95*
11932**
63.7
6841
36.5
18744**
1995-96
14525
65.9
7507
34.1
22032
1996-97
16998
64.4
9413
35.6
26411
1997-98
20640
64.6
11316
35.4
31956
1998-99
23903
64.8
12957
35.2
36860
1999-00
28965
62.6
17303
37.4
46268
2000-01
33314
63.1
19513
36.9
52827
2001-02
40509
65.3
21536
34.7
62045
2002-03
45586
65.5
23974
34.5
69560
2003-04
54977
63.2
32004
36.8
86981
2004-05
76,062
60.7
49,247
39.3
125,309
2005-06
105,350
58.4
75,136
41.6
180,486
2006-07
138,455
60.4
90,945
39.6
229,400
2007-08
181,393
71.2
73,265
28.8
254,658
2008-09
210,461
69.7
91,447
30.3
301,908
2009-10
276,656
71.9
107,858
28.1
384,514
2010-11
335,550
71.7
132,741
28.3
468,291
2011-12
396,158
77.5
114871
22.5
511,029
*: Data are from RBI's Handbook of Statistics on Indian Economy 2006-07.
**: The total includes
`
407 crore of crop loans issued by state governments.
Source:
NABARD Annual Report 2011-12 and earlier issues.


