156
In term loans, the dominance of commercial banks has been even more
and on rising scale. This share was about 50% in the early 1990s and it had
reached over 90% by 2005-06 as per the NABARD series. Thereafter, as per
the
Handbook
series also, the rising trend has been sustained and has reached
about 79% by 2009-10.
Increased Support for Allied Activities within Term Loans for Agriculture
Within agricultural loans, there are significant amounts of loans for
allied activities, but details of short-term and long-term loans for them are
not available in the official data base reviewed here. However, in the NABARD
data series on ground-level flow of farm credit, there is a set of sub-divisions
under investment credit for agriculture, which obviously constitutes lendings
in favour of allied activities; specific sub-groups in this set are: (i) plantation
and horticulture (ii) animal husbandry; and (iii) fisheries. There are two other
sub-groups, namely, (iv) high-tech agriculture and (v) others (including storage
and market yards, forestry and waste land development, bullock and bullock
carts, bio-gas and RIDF).
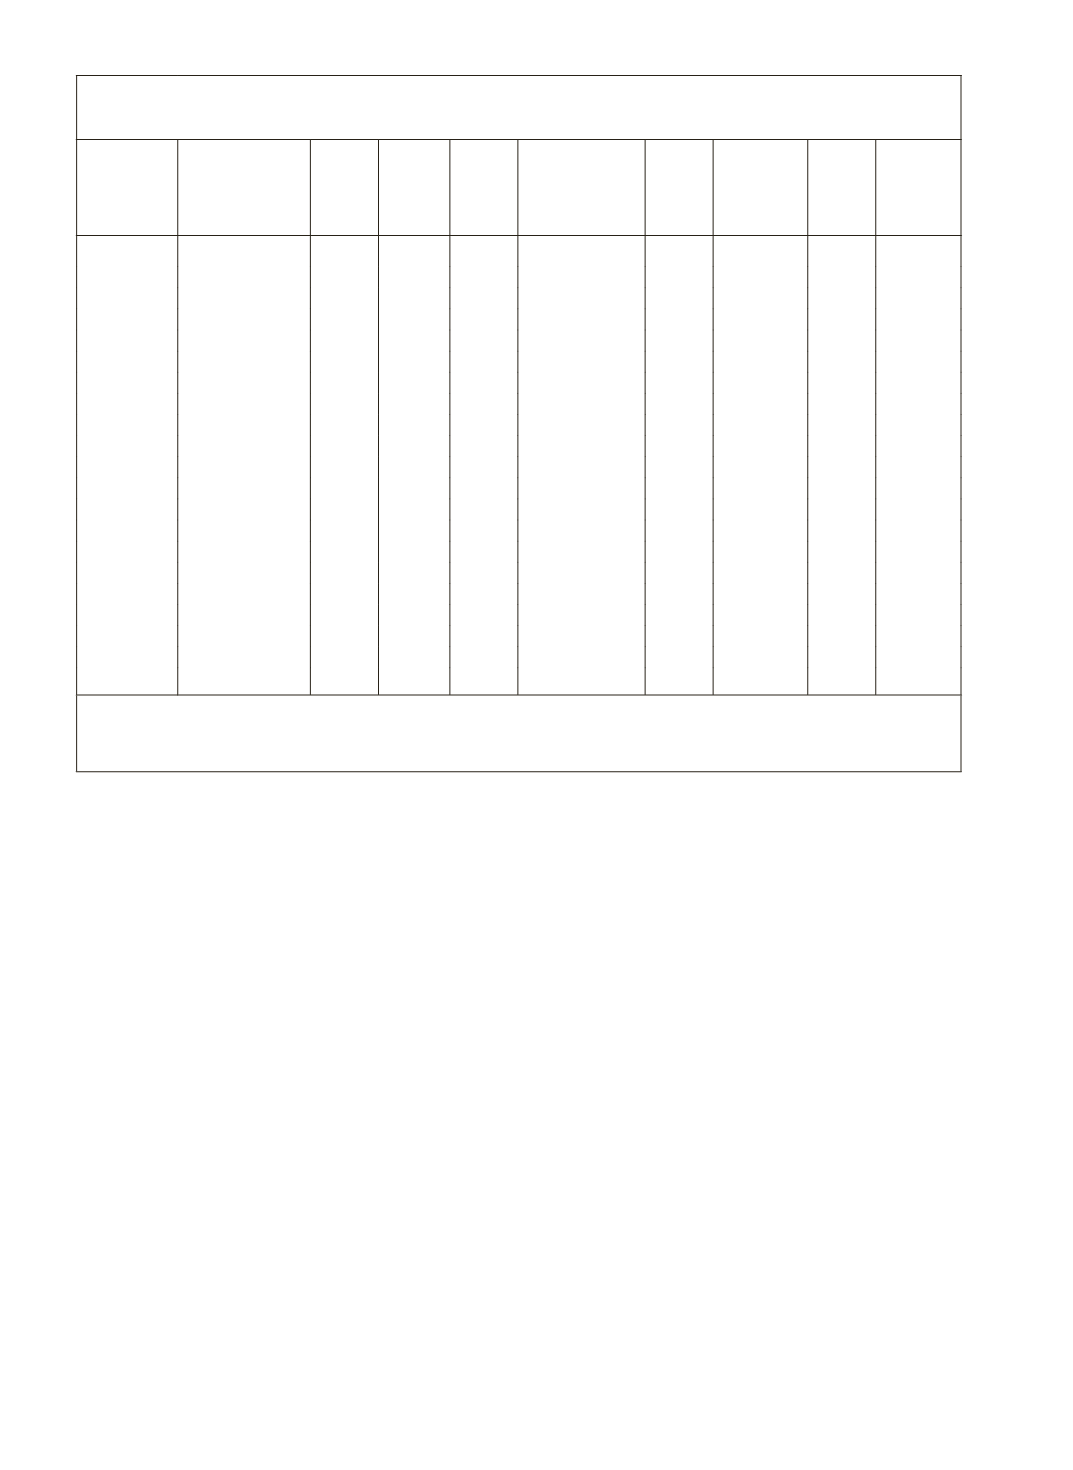
B. Terms Loans (Medium Term & Long Term - Investment Credit)
(
`
crore)
Year
Co-operative
Banks
Per
cent
to
Total
RRBs Per
cent
to
Total
Commercial
Banks
Per
cent
to
Total
Other
Agencies
Per
cent
to
Total
Total
1991-92
1992-93
2208
43.5 342 6.7
2528
49.8
5078
1993-94
2278
43.6 245 4.7
2700
51.7
5223
1994-95*
2879
42.1 395 5.8
3566
52.1
6841
1995-96
2148
28.6 532 7.1
4827
64.3
7507
1996-97
2616
27.8 563 6.0
6234
66.2
9413
1997-98
3098
27.4 644 5.7
7482
66.1
92
11,316
1998-99
3356
25.9 750 5.8
8821
68.1
30
12,957
1999-00
3489
20.2 749 4.3
13036
75.3
29
0.2 17,303
2000-01
4190
21.5 974 5.0
14321
73.4
28
0.1 19,513
2001-02
4737
22.0 1077 5.0
15683
72.8
39
0.2 21,536
2002-03
3968
16.6 1295 5.4
18670
77.9
41
0.2 23,974
2003-04
4235
13.2 1493 4.7
26249
82.0
27
0.1 32,004
2004-05
4074
8.0 2394 4.7
44688
87.2
89
0.2 51,245
2005-06
4474
6.0 2511 3.3
67837
90.3 314
0.4 75,136
2006-07
3858
4.2 3804 4.2
83283
91.6
90945
2007-08
3169
4.8 4099 6.2
58798
89.0
66066
2008-09
5962
6.5 4352 4.8
81133
88.7
91447
2009-10
6551
6.1 5415 5.0
95892
88.9
107,858
2010-11
9083
6.8 6172 4.6
117486
88.5
132,741
2011-12
6134
5.3 7049 6.1
101688
88.5
114,871
*: This solitary gap filled in from RBI’s
Hand Book
series.
Source:
Special Tabulations supplied for the project by NABARD up to 2005-06 and thereafter, from Agricultural
Statistics at a Glance, 2012 (Ministry of Agriculture (See Annexure O).


