155
Overall, what seems obvious is the continued dominance of crop loans
(or short-term loans) in the dispensation of credit flow from the banking system
including cooperatives. The share of such crop loans which had slipped from
around 67-68% in the early 1990s to 60% by 2006-07, registered a sharp
increase to near 78%, in the latest period.
Commercial Banks Remain Major Purveyors of Even Crop Loans
Available data on distribution of crop loans and term loans by agency
suggests that even in crop loans, commercial banks dominate and generally
on a rising scale. The share of cooperative banks in crop loans was over 70%
in the early 1990s and it fell to about one-third in 2005-06, after the first
year of farm credit doubling. Thereafter, there has occurred a steep decline in
this ratio around 21% by 2011-12. Correspondingly, the share of RRBs and
commercial banks together has further shot up from 66.8%, in 2004-05 to
near 80% during the above period; earlier in the early 1990s this share was
less than 30%.
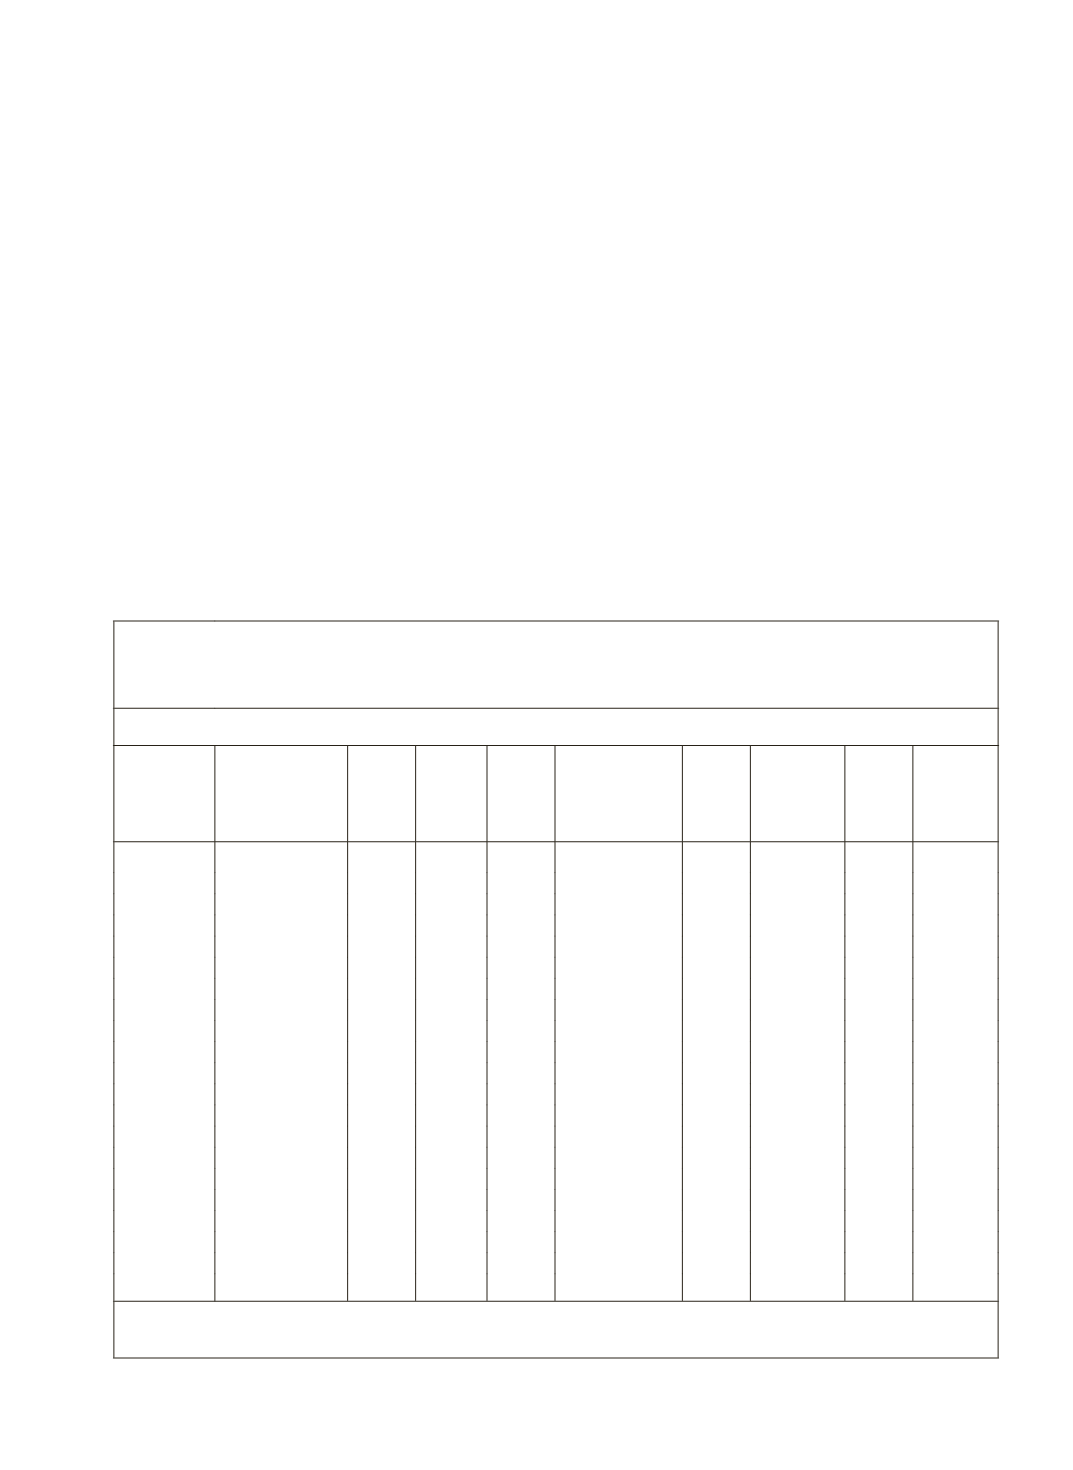
Table 5.10: Agency-wise and Sub-sector-wise Ground Level Credit Flow for
Agriculture and Allied Activities: Official Series
(
`
crore)
A. Crop Loan (Short Term - Production Credit)
Year
Co-operative
Banks
Per
cent
to
Total
RRBs Per
cent
to
Total
Commercial
Banks
Per
cent
to
Total
Other
Agencies
Per
cent
to
Total
Total
1991-92
1992-93
7170
71.1 489 4.8
2432
24.1
10091
1993-94
7839
69.6 732 6.5
2700
24.0
11271
1994-95*
7250
58.6 688 5.8
3842*
32.2
11780
1995-96
8331
57.4 849 5.8
5345
36.8
14525
1996-97
9328
54.9 1121 6.6
6549
38.5
16998
1997-98
10877
52.7 1396 6.8
8349
40.5
18
20640
1998-99
12514
52.4 1710 7.2
9622
40.3
59
23905
1999-00
14771
51.0 2423 8.4
11697
40.4
74
0.3
28965
2000-01
16528
49.6 3245 9.7
13486
40.5
55
0.2
33314
2001-02
18787
46.4 3777 9.3
17904
44.2
41
0.1
40509
2002-03
19668
43.1 4775 10.5
21104
46.3
39
0.1
45586
2003-04
22640
41.2 6088 11.1
26192
47.6
57
0.1
54977
2004-05
27157
36.7 10010 13.5
36793
49.7 104
0.1
74064
2005-06
34930
33.2 12712 12.1
57640
54.7
68
0.1 105,350
2006-07
38622
27.9 16631 12.0
83202
60.1
138,455
2007-08
40515
22.1 20715 11.3 122289
66.6
183,519
2008-09
40230
19.1 22413 10.6 147818
70.2
210,461
2009-10
56946
20.6 29802 10.8 189908
68.6
276,656
2010-11
69038
20.6 38121 11.4 228391
68.1
335,550
2011-12# 81829
20.7 47401 12.0 266928
67.4
396,158
*: Data are from RBI's Handbook of Statistics on Indian Economy 2006-07.
#: Provisional


