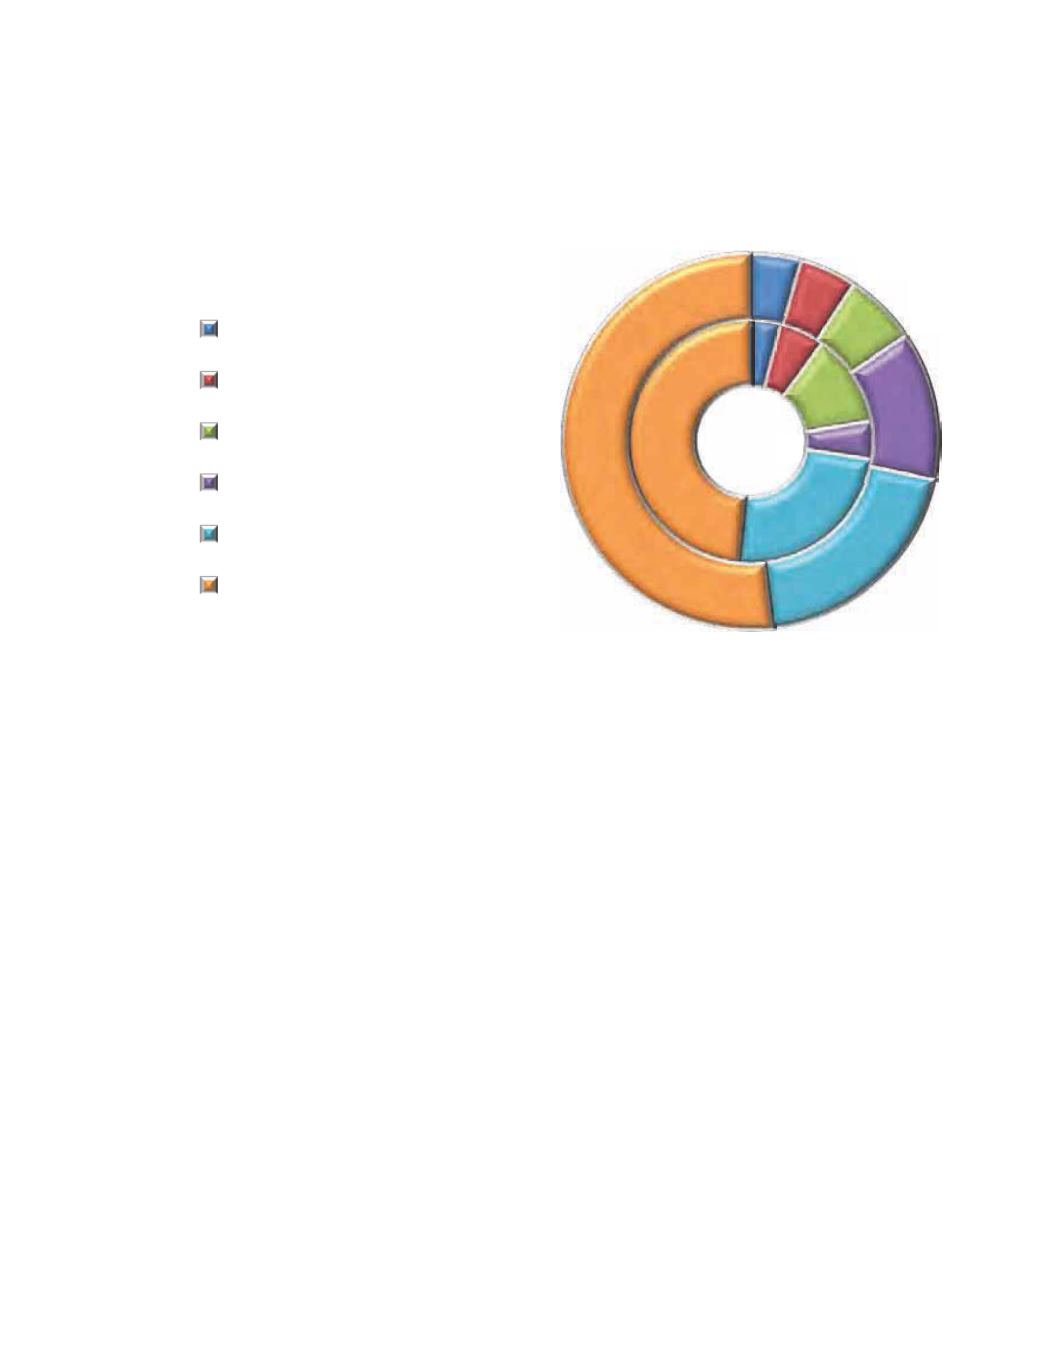
 
          [ 29 ]


              Figure 4.10


          REGION-WISE DISTRIBUTION OF AMOUNT OF NPA (%)
        
        
          AGENCY-WISE DISTRIBUTION OF SHG BANK LINKAGE
        
        
          PROGRAMME
        
        
          Commercial Banks by virtue of their vast network take
        
        
          the lead in SHG-BLP. More than half (44.4 lakh, 52%) of the SHGs in
        
        
          the country maintain their savings account with the Commercial Banks.
        
        
          During 2016-17, the share of Commercial Banks in terms of SHGs with
        
        
          savings linkage increased by 7.4%. Commercial Banks accounted for 63%
        
        
          of the savings outstanding of SHGs (Table 4.4). On the other hand, RRBs
        
        
          accounted for 30% of SHGs and they have added 3.3 lakh SHGs, almost
        
        
          half of net addition of SHGs during the year and accounted for 22% of
        
        
          savings of the SHGs. The performance of Cooperatives on the other hand
        
        
          remained subdued with 18% SHGs and 14% of savings outstanding. Bank-
        
        
          wise status of savings outstanding of SHGs as on 31 March 2017 is given
        
        
          in Statement I-A.
        
        
          During 2016-17, Commercial Banks disbursed
        
        
          R
        
        
          24,297 crore (
        
        
          R
        
        
          25,185
        
        
          crore in 2015-16) to 11.16 lakh SHGs (11.32 lakh in 2015-16) with an
        
        
          average of
        
        
          R
        
        
          2,17,629 (
        
        
          R
        
        
          2,22,482 in 2015-16) per SHG, against national
        
        
          average of
        
        
          R
        
        
          2,04,314. Commercial banks accounted for 63% of bank
        
        
          loans disbursed to 59% SHGs during the year. During the year Commercial
        
        
          banks have disbursed lesser amount of loan to lower number of SHGs as
        
        
          compared to 2015-16 (Table 4.5)


              4.8


          4%
        
        
          6%
        
        
          12%
        
        
          5%
        
        
          24%
        
        
          49%


            4%


            5%


            6%


            13%


            20%


            52%


          Inner Circle : 2015-16
        
        
          Outer Circle : 2016-17
        
        
          North Eastern Region
        
        
          Northern Region
        
        
          Central Region
        
        
          Western Region
        
        
          Eastern Region
        
        
          Southern Region