[ 33 ]
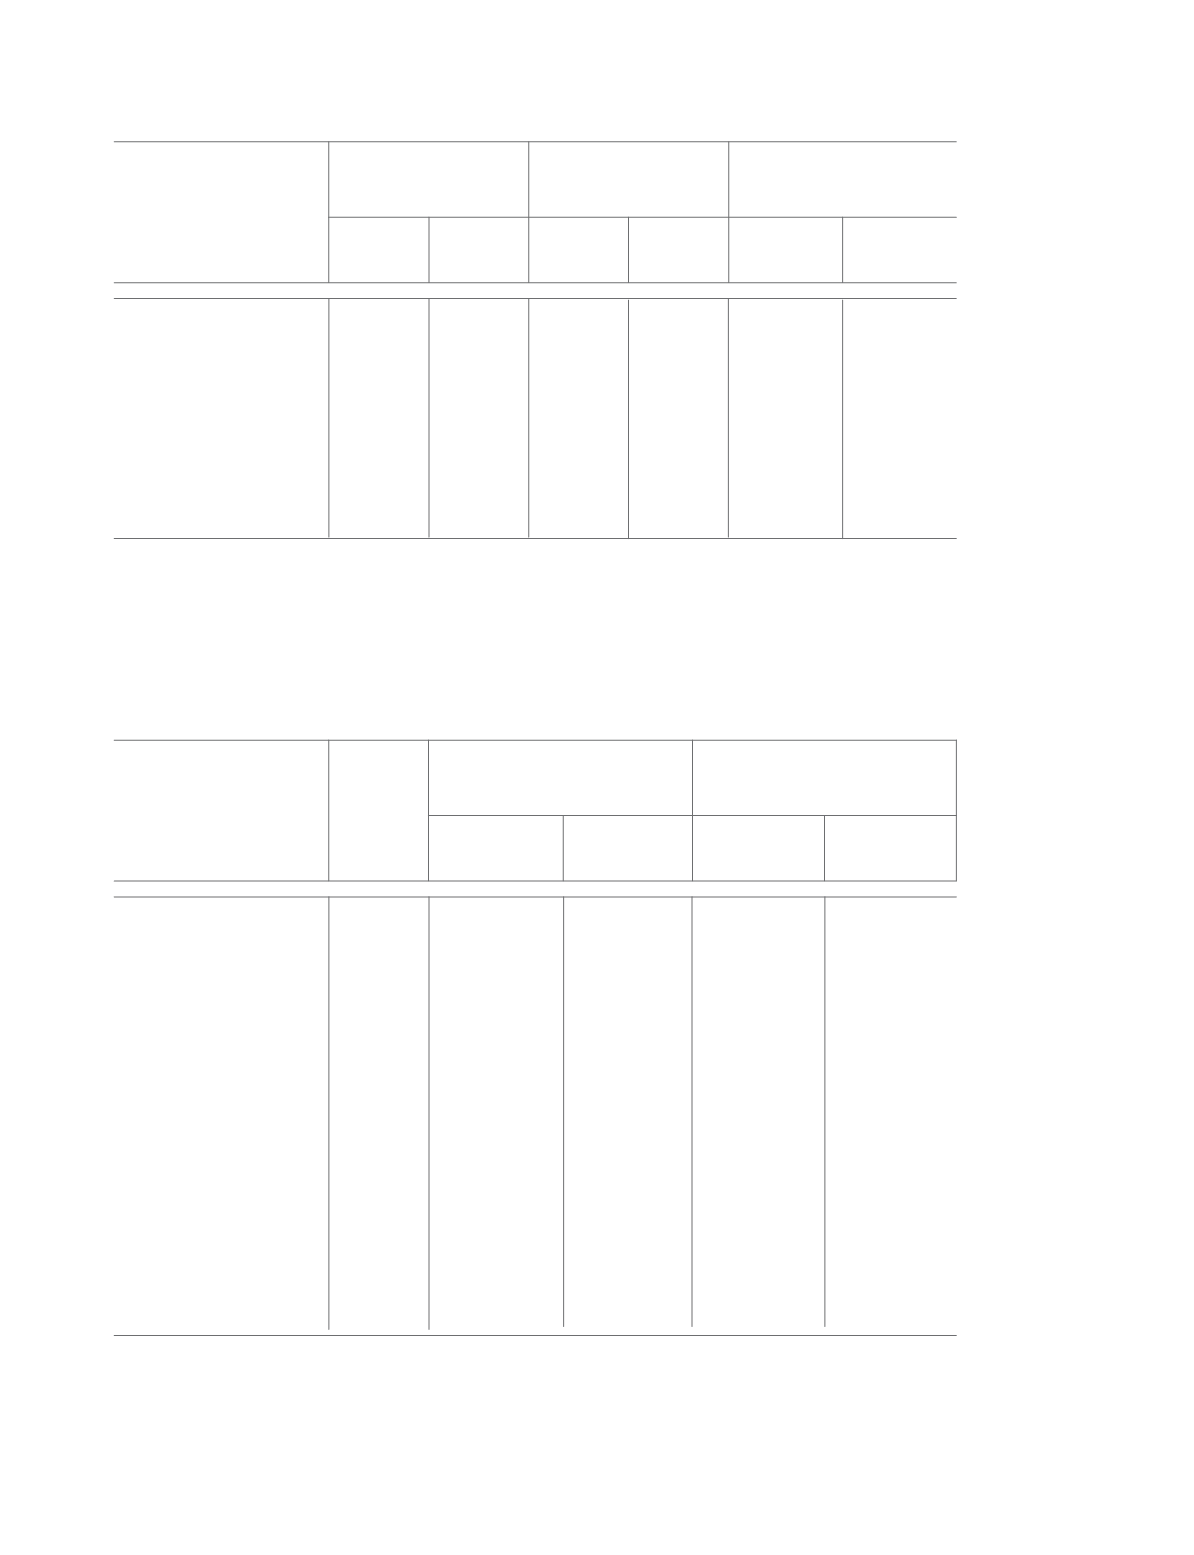
Table 5.1
Table 5.2
PROGRESS UNDER MFI-BANK LINKAGE
LOANS TO MFIs BY BANKS/FINANCIAL INSTITUTIONS
2014-15
Loans disbursed to MFls
during the year
Loans outstanding against
MFls as on 31 March
No. of
accounts
No. of
loan accounts
No. of
loan accounts
No. of
accounts
No. of
accounts
Amount
Amount
(
r
Crore)
Amount
(
r
Crore)
Amount
Amount
2015-16
2016-17
Particulars
Financing
agency
Period
Loans disbursed by
banks/Fls to MFls
Loans outstanding
against MFls as on 31st
March
Loan outstanding as %
of fresh loans
Commercial Banks
Regional Rural Banks
Cooperative Banks
SIDBI
Total by all agencies
589
4662
541
564
1430
15
31
13
0
3
834
33
49
37
589
647
2314
13858.64
19324.14
17091.33
47.69
52.42
37.83
0
6.00
207.33
1283.80
1413.01
1967.90
15190.13
20795.57
19304.38
4445
1561
3328
131
344
250
0
17
1682
86
98
97
4662
2020
5357
18720.61
22682.85
25089.18
1186.62
210.23
78.75
0
11.76
261.54
2593.23
2676.00
3795.98
22500.46
25580.84
29225.45
2014-2015
2015-2016
2016-2017
2014-2015
2015-2016
2016-2017
2014-2015
2015-2016
2016-2017
2014-2015
2015-2016
2016-2017
2014-2015
2015-2016
2016-2017
15190.13
(47.73%)
22500.46
(36.22%)
148.13
647
2020
20795.57
(36.90%)
25580.84
(13.69%)
123.00
2314
5357
19304.38
(-7.17%)
29225.45
(14.25%)
151.39
Source: Reporting Banks
(Amount in Crore)
(Figures in parenthesis indicates growth/decline over the previous year)
Source: Reporting Banks
Bank-wise details of MFIs financed are given in Statement VII. (In case of abridged version, refer to enclosed CD
for Statements).


